
Rail Week Ending Saturday, June 5 - Moderate Slowing In Intuitive Sectors
Week 22 of 2021 shows the same week total rail traffic (from the same week one year ago) improved according to the Association of American Railroads (AAR) traffic data. Total rail traffic is now surging as it is being compared to the pandemic lockdown period one year ago.

Analyst Opinion of the Rail Data
We are now seeing great rail growth as the data is being compared to the coronavirus lockdown period last year.
Total rail traffic has two components - carloads and intermodal (containers or trailers on rail cars). This week again both carloads and intermodal continued in expansion year-over-year - with the rate of acceleration of growth slowing.
We review this data set to understand the economy. The intuitive sectors (total carloads removing coal, grain, and petroleum) expanded 16.5 % year-over-year for this week. We primarily use rolling averages to analyze the intuitive data due to weekly volatility - and the 4 week rolling year-over-year average for the intuitive sectors slowed from +35.5 % to +30.0 %
When rail contracts, it suggests a slowing of the economy.
The following graph compares the four-week moving averages for carload economically intuitive sectors (red line) vs. total movements (blue line):

This analysis is looking for clues in the rail data to show the direction of economic activity - and is not necessarily looking for clues of the profitability of the railroads. The weekly data is fairly noisy, and the best way to view it is to look at the rolling averages (carloads [including coal and grain] ).
A summary for this week from the AAR:
For this week, total U.S. weekly rail traffic was 489,144 carloads and intermodal units, up 12.9 percent compared with the same week last year.
Total carloads for the week ending June 5 were 227,497 carloads, up 18.1 percent compared with the same week in 2020, while U.S. weekly intermodal volume was 261,647 containers and trailers, up 8.7 percent compared to 2020.
For some rail traffic categories, percentage changes for the current week compared with the same week in 2020 are inflated because of the widespread shutdowns — and subsequent large reduction in rail volumes — that impacted many economic sectors last year at this time.
Nine of the 10 carload commodity groups posted an increase compared with the same week in 2020. They included coal, up 16,326 carloads, to 65,101; metallic ores and metals, up 9,915 carloads, to 23,332; and chemicals, up 4,711 carloads, to 32,602. One commodity group posted a decrease compared with the same week in 2020: nonmetallic minerals, down 892 carloads, to 29,220.
For the first 22 weeks of 2021, U.S. railroads reported cumulative volume of 5,054,790 carloads, up 7.8 percent from the same point last year; and 6,206,969 intermodal units, up 18.7 percent from last year. Total combined U.S. traffic for the first 22 weeks of 2021 was 11,261,759 carloads and intermodal units, an increase of 13.5 percent compared to last year.
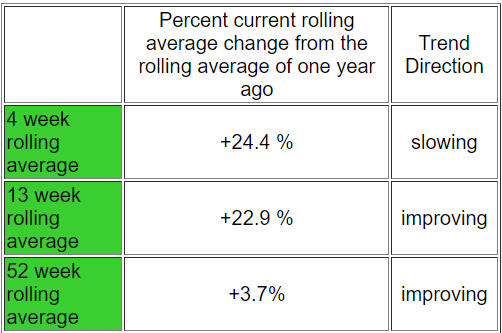
The middle row in the table below removes coal, grain, and petroleum from the changes in the railcar counts as these commodities are not economically intuitive.

(Click on image to enlarge)

Disclaimer: No content is to be construed as investment advise and all content is provided for informational purposes only.The reader is solely responsible for determining whether any investment, ...
more

