
Rail Week Ending Saturday, February 8 - Intuitive Sectors Rolling Average Improves And Is No Longer In Contraction
Week 6 of 2020 shows same week total rail traffic (from same week one year ago) contracted according to the Association of American Railroads (AAR) traffic data. Total rail traffic has been in contraction for the last year. The intuitive sector's rolling average improved this week and is no longer in contraction.

Analyst Opinion of the Rail Data
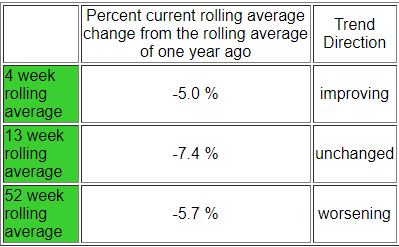
We review this data set to understand the economy. The intuitive sectors (total carloads removing coal, grain, and petroleum) contracted 0.4 % year-over-year for this week. We primarily use rolling averages to analyze the intuitive data due to weekly volatility - and the 4 week rolling year-over-year average for the intuitive sectors improved from -1.1 % to 0.0 %.
When rail contracts, it suggests a slowing of the economy.
The following graph compares the four-week moving averages for carload economically intuitive sectors (red line) vs. total movements (blue line):

Intermodal transport (containers or trailers on rail cars) growth was weak and in contraction in 2019. Last week the counts were in expansion but they returned to contraction this week.
This analysis is looking for clues in the rail data to show the direction of economic activity - and is not necessarily looking for clues of the profitability of the railroads. The weekly data is fairly noisy, and the best way to view it is to look at the rolling averages (carloads [including coal and grain] and intermodal combined).
(Click on image to enlarge)
A summary for this week from the AAR:
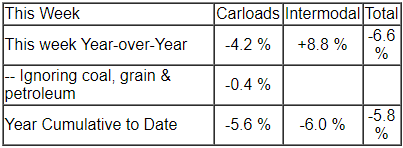
For this week, total U.S. weekly rail traffic was 485,329 carloads and intermodal units, down 6.6 percent compared with the same week last year.
Total carloads for the week ending February 8 were 232,116 carloads, down 4.2 percent compared with the same week in 2019, while U.S. weekly intermodal volume was 253,213 containers and trailers, down 8.8 percent compared to 2019.
Five of the 10 carload commodity groups posted an increase compared with the same week in 2019. They included miscellaneous carloads, up 2,404 carloads, to 10,900; farm products excl. grain, and food, up 1,205 carloads, to 16,256; and chemicals, up 887 carloads, to 32,670. Commodity groups that posted decreases compared with the same week in 2019 included coal, down 10,686 carloads, to 64,996; nonmetallic minerals, down 2,794 carloads, to 28,354; and motor vehicles and parts, down 694 carloads, to 16,376.
For the first six weeks of 2020, U.S. railroads reported cumulative volume of 1,397,849 carloads, down 5.6 percent from the same point last year; and 1,498,293 intermodal units, down 6 percent from last year. Total combined U.S. traffic for the first six weeks of 2020 was 2,896,142 carloads and intermodal units, a decrease of 5.8 percent compared to last year.
The middle row in the table below removes coal, grain, and petroleum from the changes in the railcar counts as these commodities are not economically intuitive.
(Click on image to enlarge)
(Click on image to enlarge)

Disclaimer: No content is to be construed as investment advise and all content is provided for informational purposes only.The reader is solely responsible for determining whether any investment, ...
more

