
Rail Week 46: Contraction In Economic Intuitive Sectors
Week 46 of 2018 shows same week total rail traffic (from same week one year ago) was unchanged according to the Association of American Railroads (AAR) traffic data. The economically intuitive sectors declined this week - the rolling averages advanced further into contraction.

Analyst Opinion of the Rail Data
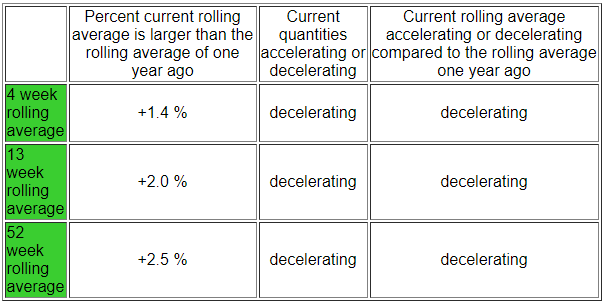
Rail growth declined this week and the overall rate of growth in 2018 has been slowly decelerating.
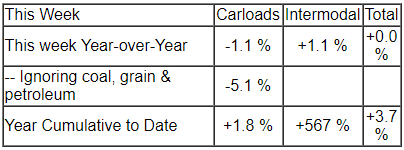
We review this data set to understand the economy. If coal, grain, and petroleum are removed from the analysis for carloads, this week it contracted 5.1 %. We primarily use rolling averages the analyze the data due to weekly volatility - and the 4 week rolling average for the intuitive sectors was declined from -0.5 % to -1.8 %.
Intermodal transport (containers or trailers on rail cars) growth slowed this week it grew 1.1 % YoY.
The following graph compares the four-week moving averages for carload economically intuitive sectors (red line) vs. total movements (blue line):

This analysis is looking for clues in the rail data to show the direction of economic activity - and is not necessarily looking for clues of profitability of the railroads. The weekly data is fairly noisy, and the best way to view it is to look at the rolling averages (carloads [including coal and grain] and intermodal combined).
A summary for this week from the AAR:
For this week, total U.S. weekly rail traffic was 546,541 carloads and intermodal units, up 0.04 percent compared with the same week last year.
Total carloads for the week ending November 17 were 262,514 carloads, down 1.1 percent compared with the same week in 2017, while U.S. weekly intermodal volume was 284,027 containers and trailers, up 1.1 percent compared to 2017.
Three of the 10 carload commodity groups posted an increase compared with the same week in 2017. They were petroleum and petroleum products, up 2,440 carloads, to 12,623; grain, up 1,668 carloads, to 23,601; and miscellaneous carloads, up 164 carloads, to 9,897. Commodity groups that posted decreases compared with the same week in 2017 included nonmetallic minerals, down 3,496 carloads, to 33,262; motor vehicles and parts, down 2,009 carloads, to 16,018; and farm products excl. grain, and food, down 613 carloads, to 16,141.
For the first 46 weeks of 2018, U.S. railroads reported cumulative volume of 12,110,985 carloads, up 1.8 percent from the same point last year; and 12,845,306 intermodal units, up 5.6 percent from last year. Total combined U.S. traffic for the first 46 weeks of 2018 was 24,956,291 carloads and intermodal units, an increase of 3.7 percent compared to last year.
The middle row in the table below removes coal, grain, and petroleum from the changes in the railcar counts as neither of these commodities is economically intuitive.
(Click on image to enlarge)

Disclaimer: No content is to be construed as investment advise and all content is provided for informational purposes only.The reader is solely responsible for determining whether any investment, ...
more

