
Promising Short-Term Trend Falls Apart
A new short-term uptrend looked so promising on Thursday, but then on Friday, it fell apart. Bad news, a President's sensitive ego and the weak seasonal period all came together to undermine stocks.
The recent price pattern of the technology ETF has the look of a bear flag. I think this would mean that the market needs another strong push lower before it finds support.
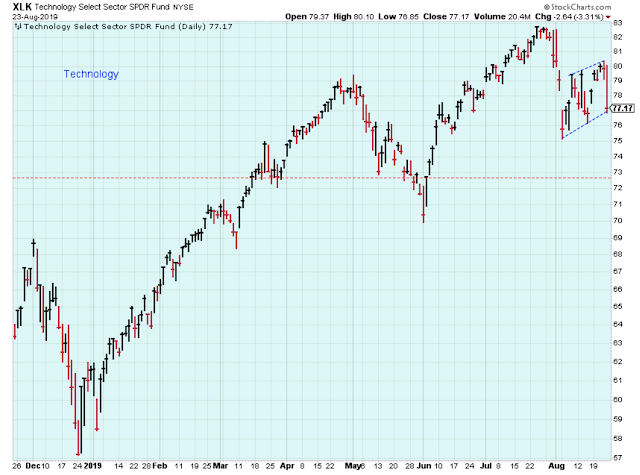
Stocks are oversold as shown by the PMO index below, and this means it is too late for me to be selling unless a stock that I hold is really breaking down. At this point in the short-term cycle, I should be looking for opportunities. It's hard to imagine being a buyer after Friday's sell-off, but that is what works for me.

Here is a comment in this week's post by Mike Burk.
The indices have about 3 weeks to hit their old highs before a nasty seasonal downturn begins.
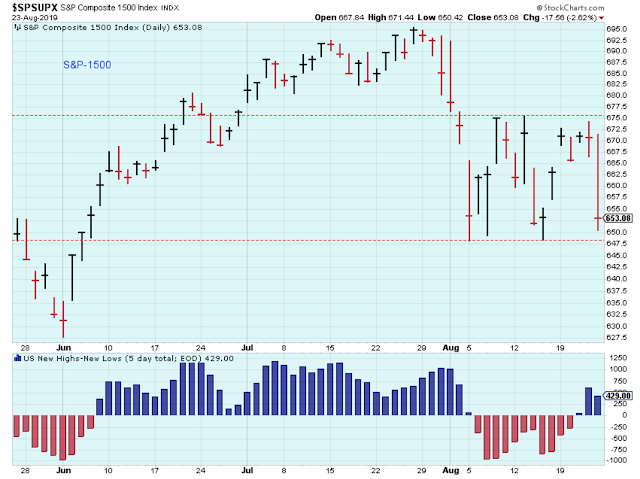
Changing focus, what's happening in the longer-term?
This trend is intact but the recent price action is choppy. The December and June market lows look important technically.

I went back to the1999 through 2002 time period to see how the market behaved as prices declined from their peaks.
Three things jump out to me.
1) There were an awful lot of net new 52-week lows for the year and a half prior to the peak, and near the peak they are dramatic. Once stocks broke down, the elevated level of net new lows persisted for half a year.
2) The 40-week average did a really good job of containing the downtrend after the peak but prices were frequently violating it prior to the peak.
3) When the peak occurred, there was the look of a double top and then a clean break below the 40-week.

Here is a similar view, but of the 2006 through 2009 time period.
1) This time, there aren't anywhere near as many new lows in the year and a half prior to the peak, but near the peak, they are again dramatic.
2)The 40-week works really well containing the downtrend similar to 2001, but the uptrend is also fairly well contained.However, prices start to violate the 40-week just before the top is in for the market.
3) When the peak occurs, there is the look of a head and shoulders top, and again it is followed by a clean break of the 40-week.

Here is a look at the current period.
1) There really aren't that many new lows before Oct-2018, and also there aren't that many net new lows after Dec-2018. But there are a ton between those two dates and this could be similar to the prior peak of 2007-2008. However, if we are really near another market peak, then there would need to be a lot more net new 52-week lows.
2) The 40-week does a good job of containing the uptrend until October, but then it gets violated in a big way. This seems similar to Aug-2007.
3) The chart pattern is hard to identify with four price highs and one significant low. Are these prices a set up for another double top or head and shoulders type of price pattern? I can't tell.

What does it all mean? The prior peaks were preceded by elevated levels of net new lows. We met this condition last fall, but we would need to see them start to pick up significantly again.
The prior peaks were preceded by violations of the 40-week, and I think the current period has met that condition with the sell off in October last year.
The prior peaks showed classic topping price patterns. These patterns can't be identified until after the breakdown, but the four price peaks could be setting up for something similar.
I know that all this analysis is debatable, but this is my best effort. It seems like the key here is to watch the level of net new lows. This is the element that is missing if we are near a peak.
Outlook Summary
The long-term outlook is cautious as of May-18.
The medium-term trend is down as of Aug-05.
The short-term trend is down as of Jul-19.
The medium-term trend for the price of bonds is up as of Nov-16 (prices higher, yields lower).
Investing Themes:
Treasuries, Cash
Dividend Payers, Gold Miners
Strategy During a Bull Market:
- Buy large-cap stocks and ETFs at the lows of the medium or short-term market trends
- Buy small-cap growth stocks on breaks to new highs in the early stages of market trends
- Reduce buying when the market trend is at the top of the range
- Take partial profits when the market uptrend starts to struggle at the highs
- The cardinal rule is never invest based on personal politics because the stock market can do well regardless of which political party is in control
Disclaimer: I am not a registered investment advisor. My comments above reflect my view of the market, and what I am doing with my accounts. The analysis is not a recommendation to buy, ...
more

