
Presidents' Day Seasonality
The US equity market will be closed on Monday in observance of the Presidents’ Day holiday.
Since 1971 when the Uniform Monday Holiday Act set the third Monday in February, rather than on George Washington’s birthday (February 22nd) as the Federal holiday, equity market performance during the week of Presidents’ Day has been pretty mixed. From the Friday before President’s Day through the Friday after, the S&P 500 has traded higher half the time for an average decline of 5 bps.
Taking a closer look, in the chart below we show the median returns by day for each trading day in Presidents’ week. Tuesday and Thursday have both averaged declines of 13 bps and 7 bps, respectively. Wednesday averages flat performance but the S&P 500 has only been higher 40% of the time. Despite weakness throughout most of the week, equities have tended to catch a bid by week’s end with an average 6 bps gain on Friday with a move higher 58% of the time.

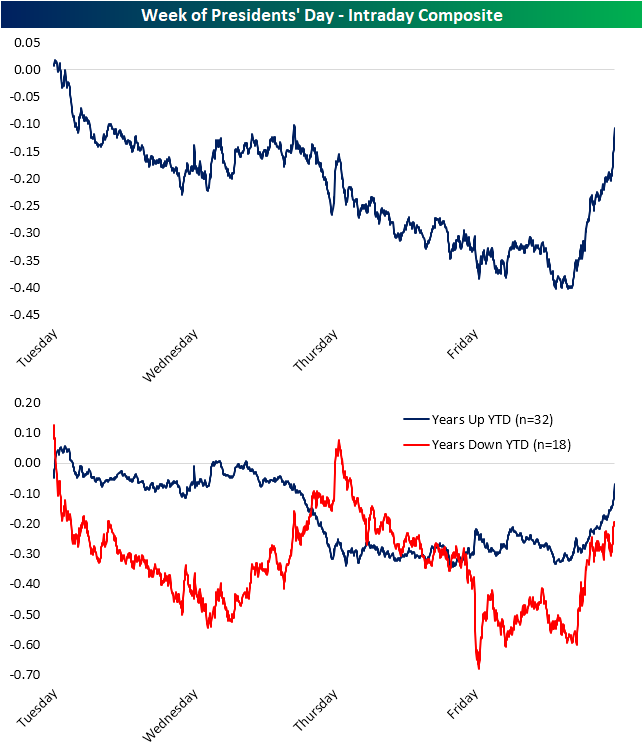
In the charts below, we show the average intraday performance of the S&P 500 during Presidents’ Day week since 1983 when our intraday data begins. We also include looks for years when the S&P 500 was up and down YTD headed into the holiday. Again, the general pattern has been a steady drift lower until Friday when the S&P 500 has tended to rebound.
We would note that the Friday rebound is not an all-day event. As shown, performance is pretty flat in the first several hours of trading with the biggest ramp higher occurring in the final of hours of tradings. That pattern is also consistent for both up and down years, though, in years that the S&P 500 was down YTD headed into the holiday there was a bit of a rebound midweek which was reversed by the end of the week.
Click here to view Bespoke’s premium membership options for our best research ...
more

