
Peeking Into The Future Thru Futures, May 17
Following futures positions of non-commercials are as of May 12, 2020.
10-year note: Currently net short 151.5k, up 9.2k.
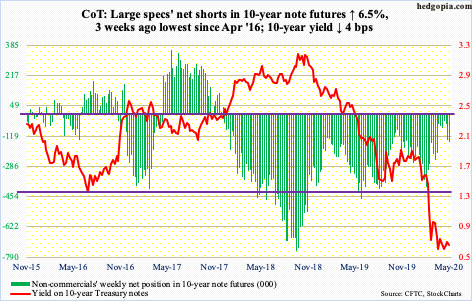
On Wednesday, Jerome Powell, Fed chair, provided a gloomy view of the economy, saying the nation was experiencing an economic hit ‘without modern precedent” and urging Congress and the White House to provide more financial support.In all probability, the Administration will not agree to Powell’s wintry diagnosis – and most definitely not the equity bulls that are hoping for a V-shaped recovery (more on this here).
Powell was being honest. Kudos to him. At the same time, by calling for more fiscal help, he is trying to make sure the stimulus burden is shared.It is thus worth watching if in the days/weeks ahead he sticks to his conviction or will come under pressure to change his tune.
It is worth recalling that until December 2018, when the Fed hiked the last time, the Powell-led FOMC expected the fed funds rate to rise two more times in 2019.The US-China trade war started in July 2018.Stocks tumbled in October-December that year.Leading into this, President Donald Trump was claiming for months that rising interest rates were putting a brake on his economic plans.On Christmas Eve 2018, he tweeted, “the only problem our economy has is the Fed.”By March 2019, the Fed capitulated, saying slower US growth means no rate rise that year.Turns out Trump was right.
This time around, Powell is right.But it is an election year.Should he continue to wax pessimistic about the economy, the Administration will fight back.Hence a potential back-and-forth between the two entities.Markets probably will not be thrilled by this.Further, the longer Powell insists on the importance of fiscal help, the more it will signal to the markets that he is running low on monetary bullets.
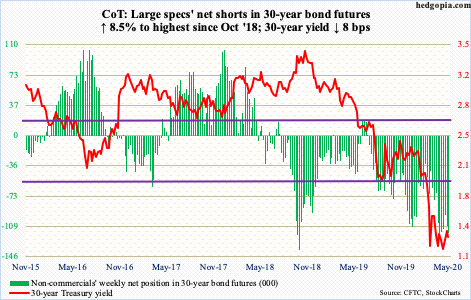
30-year bond: Currently net short 118.1k, up 9.3k.
Major economic releases next week are as follows.
The NAHB Housing Market Index (May) is due out Monday. Builder optimism cratered 42 points month-over-month in April to 30.This was the lowest reading since June 2012 and the largest one-month collapse in the series’ history; data goes back to January 1985.
Housing starts (April) are on tap Tuesday. Starts tumbled 22.3 percent m/m in March to a seasonally adjusted annual rate of 1.22 million units – an eight-month low.
Thursday brings existing home sales (April).March sales were down 8.5 percent from February’s 5.76 million (SAAR), which was the highest since February 2007.
WTI crude oil: Currently net long 689.3k, up 4.8k.
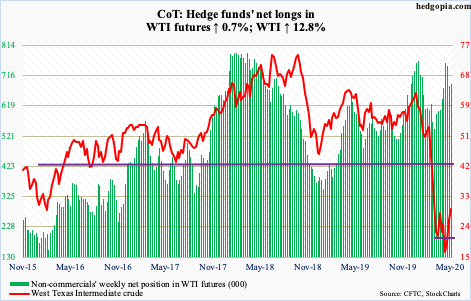
Saudi Arabia said it will cut oil production for June by an extra one million barrels/day. This is a voluntary cut and is separate from the 9.7-mb/d cut that OPEC+ is carrying out in May and June.As well, Kuwait and the UAE will be cutting by 80,000 b/d and 100,000 b/d.On Monday, the day the Saudi decision was announced, WTI ($29.52/barrel) fell 4.2 percent (Brent by 4.3 percent) but remained above the 50-day moving average.The crude continued to trade just under resistance at $27-28 – until Friday when it edged past that level.Bulls were not quite able to muscle through this ceiling but in the right circumstances now have a shot at gap-down resistance at $35.
In the meantime, US crude production continued to drop – down another 300,000 b/d in the week to May 8 to 11.6 mb/d.Production peaked in February/March at 13.1 mb/d.The EIA report also showed crude imports fell by 321,000 b/d to 5.4 mb/d.Crude and gasoline stocks declined as well – respectively down 745,000 and 3.5 million barrels to 531.5 million barrels and 252.9 million barrels.Distillate inventories, however, increased by 3.5 million barrels to 155 million barrels.Refinery utilization dropped by 2.6 percentage points to 67.9 percent.
E-mini S&P 500: Currently net short 236.3k, up 13.9k.
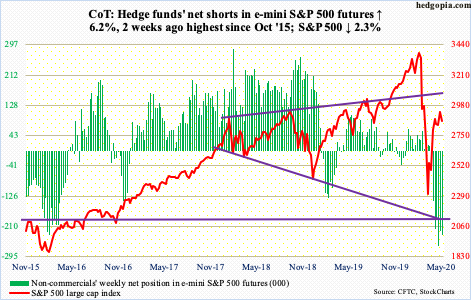
Selling pressure continued at 2940s. But at the same time bulls are unwilling to let go of 2850s-70s that easy. At one point on Thursday, the S&P 500 large cap index (2863.70) was down 5.6 percent for the week, but that weakness was bought, with the session reversing from down 1.9 percent to close up 1.2 percent.Bulls stepped up just above the daily lower Bollinger band. On Friday, too, early weakness was bought.For the week, the index ended down 2.3 percent, which bulls will take it given it was a lot worse at the weekly lows.
The daily RSI rallied above 50 in early April.A few times since then, it bounced off of the median, which helped the S&P 500.This occurred again this week.
In the week through Wednesday – before Thursday’s intraday reversal – $2.5 billion left US-based equity funds, for three-week redemptions of $25.1 billion (courtesy of Lipper).In the same week, SPY (SPDR S&P 500 ETF), VOO (Vanguard S&P 500 ETF) and IVV (iShares Core S&P 500 ETF) collectively gained $2.6 billion. This followed outflows of $19 billion in the prior four (courtesy of ETF.com).
Euro: Currently net long 78.1k, up 1.8k.
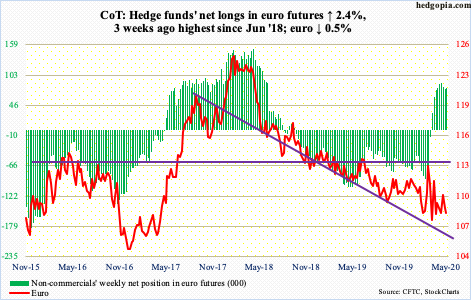
Once again, straight-line support at $107.70s, which goes back three months, was tested this week. Early in the week, bulls tried to reclaim the 10- and 20-day, but unsuccessfully.
On March 20th, the euro ($108.21) tagged $106.35 before bottoming.The back-and-forth action since that low has helped form a pennant.The currency closed out the week right on it.A breakdown means the March low is the next reference point.
Gold: Currently net long 242.8k, down 7.2k.
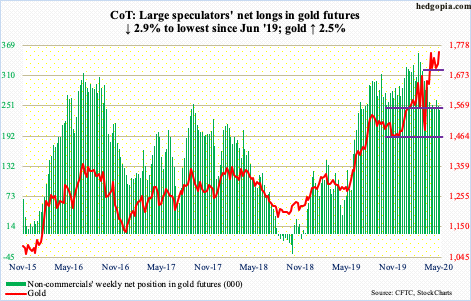
Gold ($1,756.30/ounce) broke out of $1,700 in early March.By April 14th, it tagged $1,788.80. The selling pressure since that high consistently found bids waiting at $1,700 or just below. This week, the metal dropped to $1,690s on both Monday and Tuesday, and that was bought.
Flows continued to cooperate.In the week to Wednesday, IAU (iShares Gold Trust) and GLD (SPDR Gold ETF) respectively gained $236 million and $910 million, for a cumulative eight-week total of $11.6 billion (courtesy of ETF.com).
This is in contrast to non-commercials who have been reducing their net longs, but so far it has been their loss.
Thursday, the yellow metal broke out of a month-long descending triangle.This is a continuation pattern which tends to form during a downtrend.This one has appeared during an uptrend, hence not sure what to make of it.In any case, this can signal distribution, so it is worth watching.Right here and now, gold acts like it wants to go test the April high.
Nasdaq 100 index (mini): Currently net long 8.4k, down 4.4k.
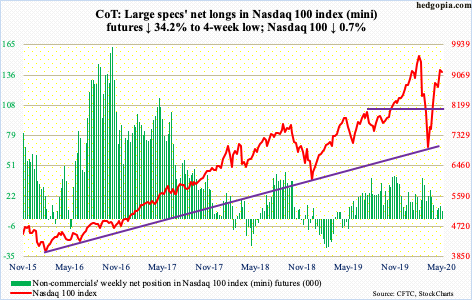
In the week ended Wednesday, $1.2 billion moved into QQQ (Invesco QQQ Trust).This was the fourth straight weekly inflows, during which $4.4 billion came in.Tech has been a leader, with help from short squeeze (more on this here), and retail in particular wants in on the action.This is also a fickle group, and it does not take long before sentiment swings the other way.
Early this week, the Nasdaq 100 (9152.64) filled the gap from late February, which then led to swift selling on Tuesday and Wednesday. Tuesday’s intraday high of 9354.45 also kissed the underside of a breached trend line from the lows of March. In the past two weeks, the index rallied all along this broken trend line.
Bears had an opening mid-week, but on both Wednesday and Thursday bulls defended the 20-day, which approximates four-month horizontal support at 8900.This needs to break for bears to get traction.From their perspective, there are some signs of distribution, with a weekly long-legged doji this week, which showed up at a crucial price point.
Russell 2000 mini-index: Currently net short 18.3k, down 4.1k.
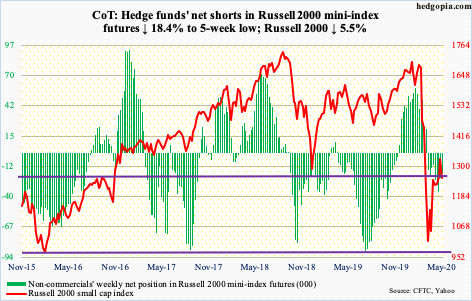
In the week to Wednesday, $2 billion came out of IWM (iShares Russell 2000 ETF), even as IJR (iShares Core S&P Small-Cap ETF) took in $270 million (courtesy of ETF.com). IWM’s flows picture may have changed Thursday when the ETF/Russell 2000 staged an impressive reversal at crucial support.
By Wednesday, the index (1256.99) was down 7.2 percent this week, losing not only five-year horizontal support at 1250s but also a rising trend line from the March bottom. Selling continued Thursday, with the Russell 2000 down 4.2 percent at one time, only for small-cap bulls to defend 1170s-80s; by close, the index edged up 0.4 percent, forming a hammer right on support. At the lows in that session, the Russell 2000 was down 11.2 percent for the week; when it was all said and done, it ended down 5.5 percent.
Leading up to this, as of the end of April, IWM shorts had been adding. It is possible, unable to take out 1170s (more on this here), they covered, which produced Thursday’s intraday reversal. In any case, for now, the Russell 2000 is stuck between 1250s and 1170s, with a bias to the upside.
US Dollar Index: Currently net long 16.5k, up 25.
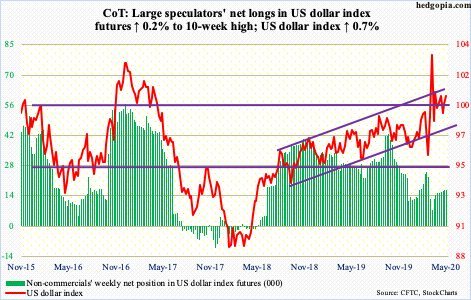
One more week and one more attempt at five-year horizontal resistance at 100.50-101. On Wednesday, the US dollar index (100.43) defended the 50-day, which is now slightly rising, then attacked that ceiling on Thursday and Friday. It increasingly feels like it is just a matter of time before a breakout occurs.After that, just north of 101 lies the upper bound of an ascending channel going back to August 2018.
VIX: Currently net short 39.7k, up 11.4k.
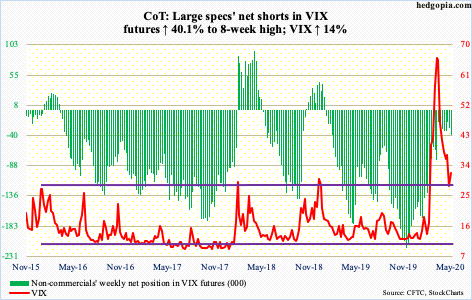
VIX’s intraday reversal higher on Tuesday after tagging 26 came right on the daily lower Bollinger band.Longer-term, this is a major support zone going back several years.For volatility bulls, the good thing is that it held.The not so good is that they were unable to take out 36-38, despite attempts both on Wednesday and Thursday.The 20-day consistently came in the way.
The daily RSI has remained under 50 since early April. Several attempts since to rally past the median have failed, including this week. Some other indicators, too, seem to want to turn back down from the median. This raises the odds that VIX (31.89) comes under pressure near term.


