
Peek Into The Future Via Commitment Of Traders This Week
Following futures positions of non-commercials are as of September 15, 2020.
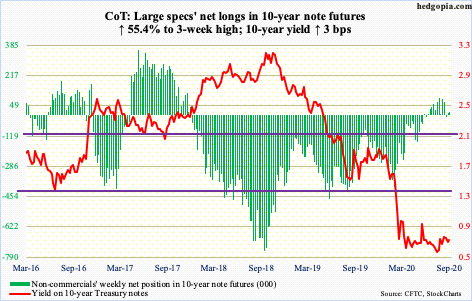
10-year note: Currently net long 14.8k, up 5.3k.
The Fed Wednesday said rates will stay zero-bound through the end of 2023. The fed funds rate in March was lowered to a range of zero to 25 basis points. FOMC members also upgraded their outlook on the economy. This year, they now expect real GDP to contract 3.7 percent and the unemployment rate to reach 7.6 percent by year-end. In June, they expected the economy to contract 6.5 percent with an unemployment rate of 9.3 percent.
It is hard to reconcile these two conflicting statements. If things are not as bad as previously thought, why is this not reflected in policy? Markets nevertheless are telling the Fed to do more. The central bank recently said it would allow inflation to rise moderately above its two percent target. Markets, on the other hand, are essentially treating this as a pipe dream, suggesting more QE is needed to achieve this.
Real rates are already negative. The Fed already holds $7.06 trillion in assets, down slightly from record $7.17 trillion from early June. At the end of last year, the balance sheet was $4.17 trillion. Markets still want more monetary morphine. The Fed, which has been bitten by the wealth effect bug, has itself to blame. It has hinted that it will backstop equities, among others. The question then becomes, how long before markets force the Fed’s hand? In other words, is it stocks correcting 10 percent, 15 percent, or any other number?
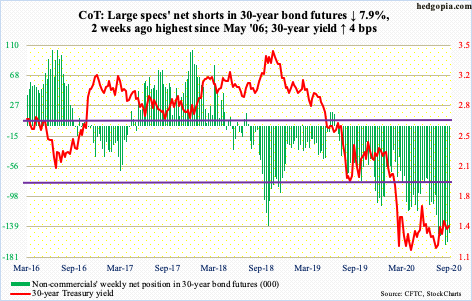
30-year bond: Currently net short 147.7k, down 12.7k.
Major economic releases next week are as follows.
The Z.1 report (2Q20) will be published Monday. This is a comprehensive report on the financial accounts of the US.
Existing home sales (August) come out Tuesday. Sales jumped 24.7 percent month-over-month in July to a seasonally adjusted annual rate of 5.9 million units. From May’s 3.9 million, sales have rallied 49.9 percent.
New home sales (August) are on tap for Thursday. Sales in July rose 13.9 percent m/m to 901,000 units (SAAR) – the highest since December 2006. From April’s 570,000 units, sales are up 58.1 percent.
Durable goods orders (August) will be reported Friday. July orders for non-defense capital goods ex-aircraft – proxy for business capex plans – dropped 0.2 percent year-over-year to $66.1 billion (SAAR). This is the fifth straight y/y drop, with improvement from down 7.3 percent in April.
WTI crude oil: Currently net long 553.9k, up 29.5k.
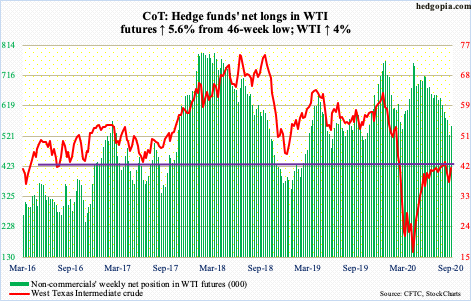
WTI ($41.32/barrel) rallied 4.9 percent Wednesday and another two percent Thursday. Wednesday’s EIA report for the week to September 11 showed US stocks of crude and gasoline dropped 4.4 million barrels and 381,000 barrels to 496 million barrels and 231.5 million barrels respectively. Crude imports, too, fell – down 415,000 barrels per day to five million b/d. Crude production increased 900,000 b/d to 10.9 mb/d; two weeks before that, production dipped to 9.7 mb/d, which was the lowest since January 2018. Distillate stocks also rose – up 3.5 million barrels to 179.3 million barrels. Refinery utilization rose four percentage points to 75.8 percent.
For the week, the crude jumped 10.7 percent. The daily was oversold. Intraday, WTI tumbled from $43.43 on the 1st to $36.13 on the 8th. There was minor support at the $36 area and it held. The 50- and 200-day have converged around $41 ($41.17 and $40.65, respectively). Bulls are now probably eyeing $43-plus, which the crude unsuccessfully tried to punch through several times last month.
E-mini S&P 500: Currently net long 21.5k, up 3.2k.
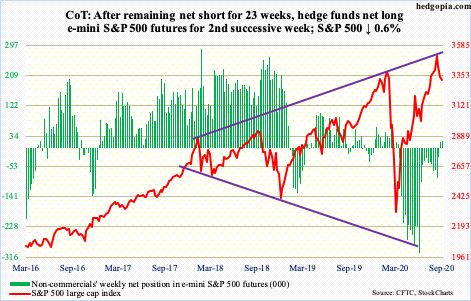
The all-time high of 3588.11 from the 2nd this month got rejected at the upper line of an ascending broadening wedge. Earlier, on March 23, the February-March selloff stopped at the lower line. This is an important technical formation.
Bulls are having to deal with this potential roadblock even as both the weekly and monthly remain in overbought territory. The S&P 500 (3319.47) rallied nearly 64 percent in five and a half months before hitting this resistance.
Concurrently, corporate buybacks have slowed down, with S&P 500 companies spending merely $88.7 billion in 2Q20 (more on this here). For months, foreigners have been aggressively purchasing US stocks, but it is possible fatigue is setting in; June’s 12-month total of $165.2 billion was the highest since April 2010. Plus, the ongoing contraction in money market funds is not finding its way into stocks; since reaching record $4.79 trillion in the week to May 20th, $373 billion have come out of these funds (courtesy of ICI). During the period, $74.6 billion left US-based stock funds (courtesy of Lipper).
The bottom line is, potential headwind is building. Until Thursday, bulls and bears were fighting over control of the 50-day (3342.96), with the latter consistently showing up at the 20-day for a couple of weeks now. Friday, the 50-day gave way. This likely opens the door to a test of straight-line support between 3230s and 3270s. Friday’s low was 3292.40.
Euro: Currently net long 178.6k, down 18.2k.
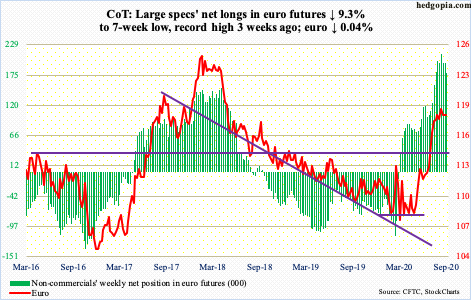
The euro ($1.1839) continues to chop. Bears continue to show up at 17-plus-year resistance at $1.19-1.20 and bulls continue to defend $1.17-$1.175. This has gone on since late July and preceded a rally from March when on the 20th the euro tagged $1.064 intraday. On the 1st this month, it hit $1.201.
Unless bulls reclaim $1.19-1.20, they could very well be swimming against the current. Non-commercials, who are aggressively net long, remain the wildcard. A breach of $1.17-1.175, followed by the 50-day at $1.1746, can potentially lead them to lighten up. After this, there is horizontal support at $1.145.
Gold: Currently net long 241k, up 4.5k.
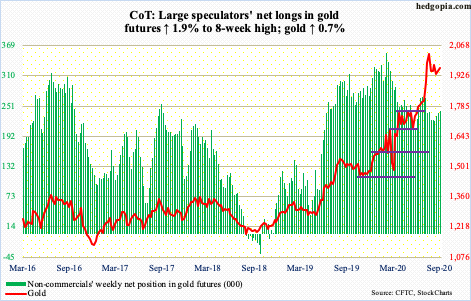
Gold ($1,962.10/ounce) cannot break the logjam. The metal rallied from $1,450.90 on March 16 to record high $2,089.20 on August 7, surpassing the prior high of $1,923.70 from September 2011 eight trading weeks ago.
Since the August high, gold is caught in a pattern of lower highs, even as bulls have consistently defended $1,920s. Flows are beginning to vacillate between inflows and outflows.
IAU’s (iShares Gold Trust) streak of inflows extended to 26 weeks, as it took in another $98 million in the week to Wednesday, for a cumulative total of $7.8 billion. GLD (SPDR Gold ETF) experienced another down week – its fifth in 26 – losing $314 million in the week to Wednesday, for a cumulative 26-week total of $18 billion (courtesy of ETF.com). A combined $3.4 billion has come in after the aforementioned breakout in gold. A loss of $1,920s can test the mettle of these longs. That said, as long as breakout retest is good, gold bugs deserve the benefit of the doubt. A decisive breach opens the door to a test of $1,750-1,800.
Nasdaq 100 index (mini): Currently net short 80.9k, up 62.4k.
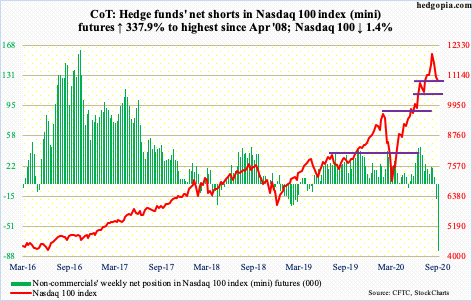
This week’s early rally attempts were denied at the now-sharply falling 10-day. A 10/20 cross-down has already formed. Thursday, the Nasdaq 100 (10936.98) lost the 50-day.
In the week to Wednesday, QQQ (Invesco QQQ Trust) lost $1.4 billion. This comes on the heels of outflows of $555 million in the prior week (courtesy of ETF.com).
Now that 11000 is breached, next area of support lies at 10300-10400.
In the meantime, non-commercials’ net shorts rose to the highest since April 2008. Bulls will be viewing this as a reason for short squeeze, but for that, they need to regroup and defend important support, forcing the shorts to cover. Back then, the Nasdaq 100 suffered a nasty selloff in September-November.
Russell 2000 mini-index: Currently net long 16.6k, up 1k.
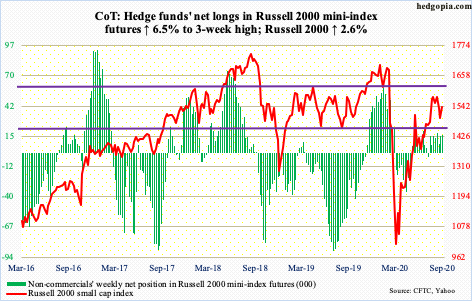
On August 11, the Russell 2000 (1536.78) tagged 1603.60 intraday but only to close poorly at 1575.10. Resistance just north of 1600 goes back to January 2018. Since that failure, sellers began showing up at 1570s, which is where they denied this week’s rally attempts. Monday’s intraday drop to just under 1500 was aggressively bought. The rally that followed went as high as 1572.06 on Wednesday, but only to meet with resistance.
The index has lost a rising trend line from its March low. Unless 1570s, followed by 1600-plus, is recaptured, the path of least resistance is toward the 200-day at 1461.76, which lines up with horizontal support at 1450s-60s. After this, there is support at 1340s-50s.
US Dollar Index: Currently net short 8.2k, up 2.5k.
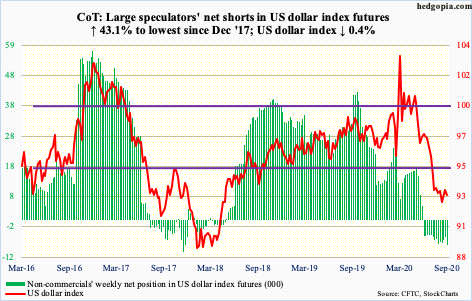
Since late July, the US dollar index (92.95) has pretty much been going back and forth between 92 and 94, give and take. This preceded a five-plus-month drop from 103.96 on March 23 to 91.75 on the 1st this month.
Bulls have defended support at 92, which goes back 17 years, but have faced difficulty clearing 94, or just below. Thursday, the index rallied to 93.63 intraday but only to close at 92.97; the 50-day at 93.65 lied there as well, as did the daily upper Bollinger band.
A range breakout can lead the bulls to eye 96, or thereabouts. On the downside, there is support at 88-89.
VIX: Currently net short 92.2k, up 580.
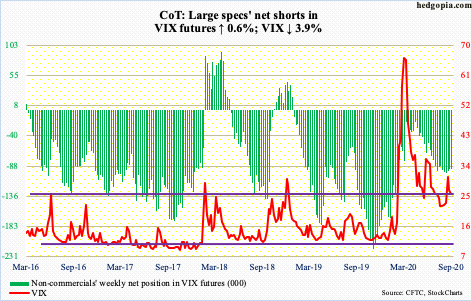
When on the 4th this month VIX reversed sharply lower from the intraday high of 38.28, the daily RSI began to drop from just above 70. Monday, the RSI dropped below 50, closing Friday at 48.8. If downward momentum persists, volatility bears would be eyeing at least mid-30s. In this scenario, VIX (25.83) goes lower.
After losing the 200-day last Friday, VIX started this week with more downward pressure, but the 50-day provided support. In the next couple of sessions, the volatility index continued to hug the average (25.28), which also approximates straight-line support at mid-20s. Thursday’s rally attempt, then, got rejected at the 200 day (29.01).
In short, VIX for now remains trapped between the 50- and 200-day. Either way it breaks, momentum likely follows in the near term. Medium- to long-term, VIX has room to rally a lot higher.


