
Palladium May Rise With Oil-Linked NOK On Powell Testimony
FED CHAIRMAN JEROME POWELL CONGRESSIONAL TESTIMONIES
Fed Chairman Jerome Powell will be giving two congressional testimonies to the House Financial Services Committee and Senate Bank Committee. If he strikes unexpectedly optimistic tones – especially after last week’s NFP numbers – it may kindle risk appetite and boost demand for commodities like palladium and currencies like the oil-linked Norwegian Krone.
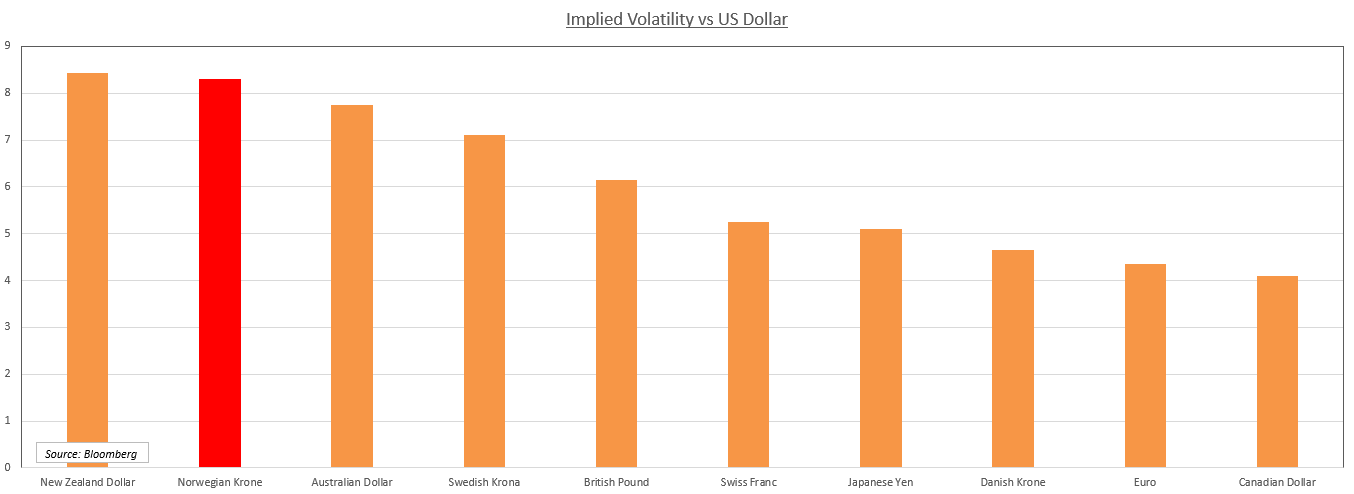
Norwegian Krone Expected to be Second Most-Volatile Currency vs US Dollar Over One Week
(Click on image to enlarge)
US-CHINA TARIFF REDUCTION: WHAT NEXT?
The US and China are both expected to lower tariffs against each other as part of their initial agreement in “Phase 1” of their multi-sequential trade deal. There were some concerns that due to the coronavirus outbreak and impact it is having on China that it would not be able to meet certain trade stipulations outlined the accord. For Palladium, weaker demand from the Asian giant could spell doom for its unprecedented rally.
However, news on Friday indicated US President Donald Trump and his Chinese counterpart Xi Jinping remain committed to the implementation of “Phase 1”. Those fading fears may then boost sentiment and make investors more inclined to trade growth-sensitive assets. Consequently, if this same kind of rhetoric is reaffirmed on Friday, Brent, palladium and the Norwegian Krone may rise.
RIKSBANK RATE DECISION: WHAT TO EXPECT
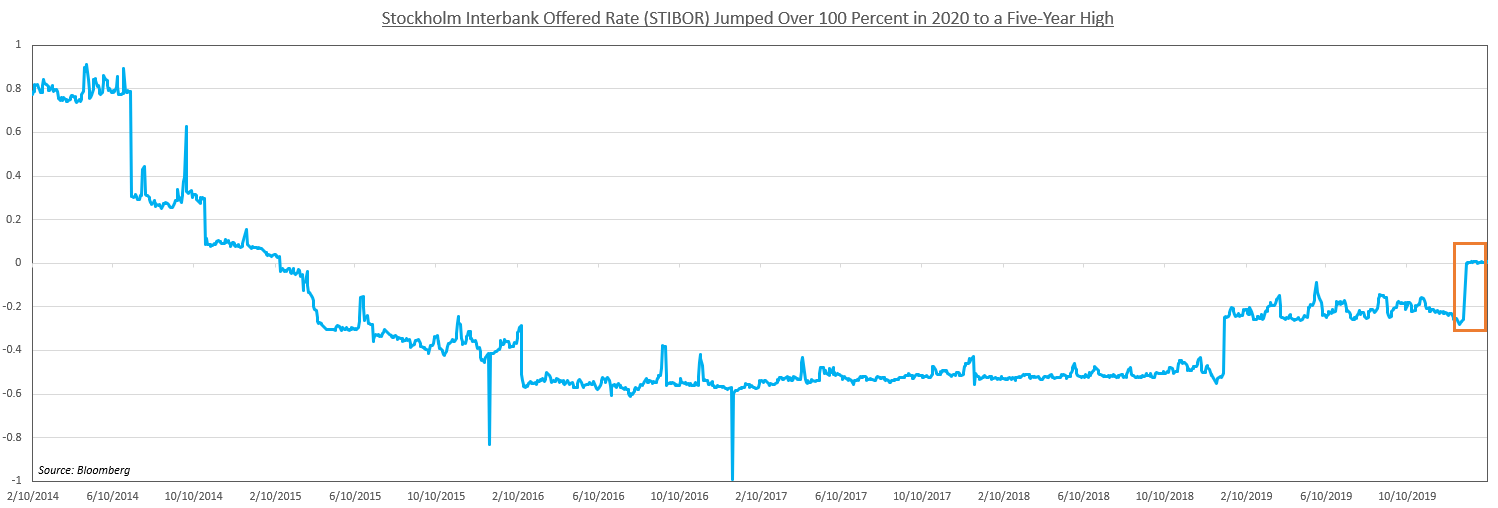
The Riksbank is expected to hold interest rates at zero percent after it exited negative rate territory late last year. Volatility in the Swedish Krona will therefore likely come from commentary by officials and their outlook on policy. Swedish credit markets have shown recent jitters with the Stockholm Interbank Offered Rate having jumped over 100 percent since the start of the year and is now at its highest point since 2015.
While this may not constitute an immediate emergency, the sharp rise in interbank lending rates could speak to an underlying problem that has yet to reveal itself. One concern is the ballooning of household debt that has gone hand in hand with the steep rise in housing prices. Mortgage lending totals $450 billion with banks remaining highly-exposed to the market with alarmingly-low liquidity and exposure to external risks.
STIBOR
(Click on image to enlarge)
OPEC MONTHLY REPORT
OPEC will be releasing its monthly oil market report on February 13 which may rattle the petroleum-tied Norwegian Krone if it shows weaker demand forecasts. Concerns about the coronavirus sapping growth are at the back of everyone’s minds, though it is too early to assess the extent of its impact. This report may therefore provide insight as to how producers believe the Wuhan virus will affect demand for the commodity.
USD/SEK TECHNICAL ANALYSIS
USD/SEK has risen almost four percent since it bottomed out at the December 31 swing-low at 9.2948 and started to climb along the steep uptrend. However, the pair is flirting with what could be either an upward continuation or a bearish correction as it approaches trend-defining resistance between 9.6878 and 9.7228. Failure to clear the multi-tiered ceiling could trigger a selloff and retest of the 9.5323-9.4996 support zone.
USD/SEK – Daily Chart
(Click on image to enlarge)
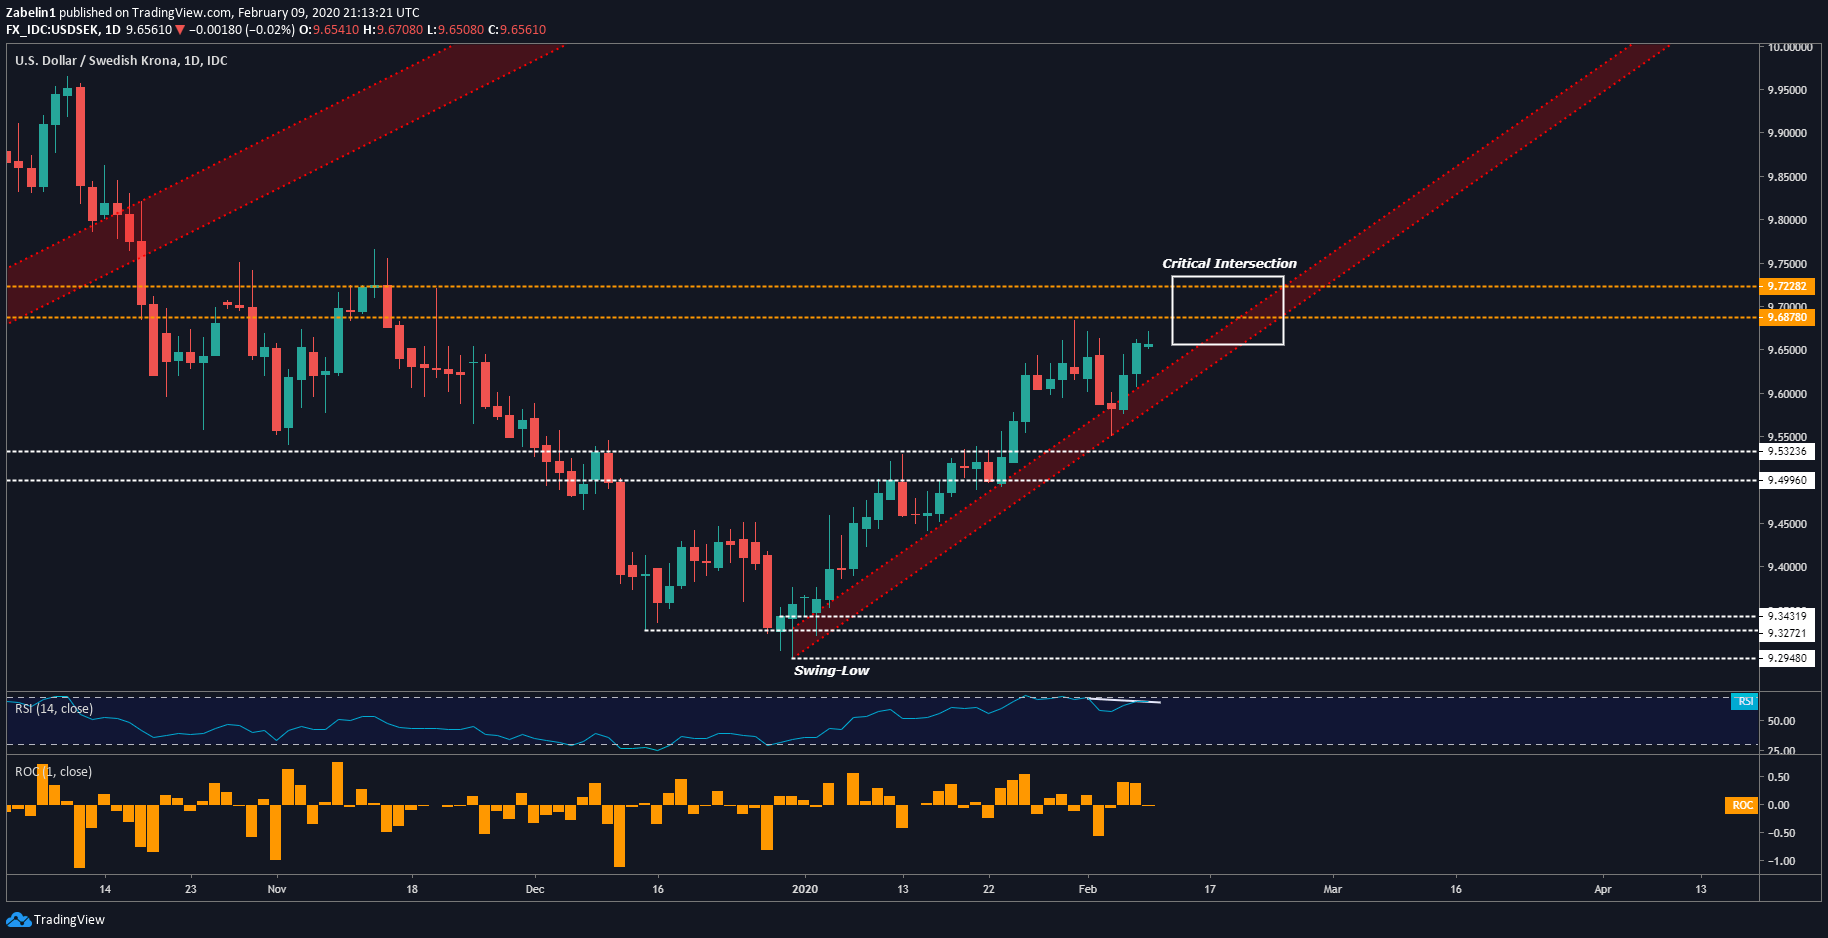
USD/SEK chart created using TradingView
USD/NOK OUTLOOK
Not entirely by surprise, USD/NOK has also experienced a similar trajectory and is consequently in the same dilemma as USD/SEK. Negative RSI divergence and the retreat from resistance at 9.3057 – combined with the narrow gap between the uptrend and ceiling – suggests the pair may undergo a bearish correction. Selling pressure may alleviate around familiar support at 9.200.
USD/NOK – Daily Chart
(Click on image to enlarge)

USD/NOK chart created using TradingView
XPD/USD PRICE CHART
XPD/USD recently experienced a downside breakout below the December uptrend as it was closing the gap between rising support and resistance at 2499.50. Looking ahead, if the precious metal has another daily close below the uptrend, XPD/USD may retreat to support at 2108.36. At that level, selling pressure may be overwhelmed by buyers looking purchase the best-performing metal of 2019 at a discount.
XPD/USD – Daily Chart
(Click on image to enlarge)
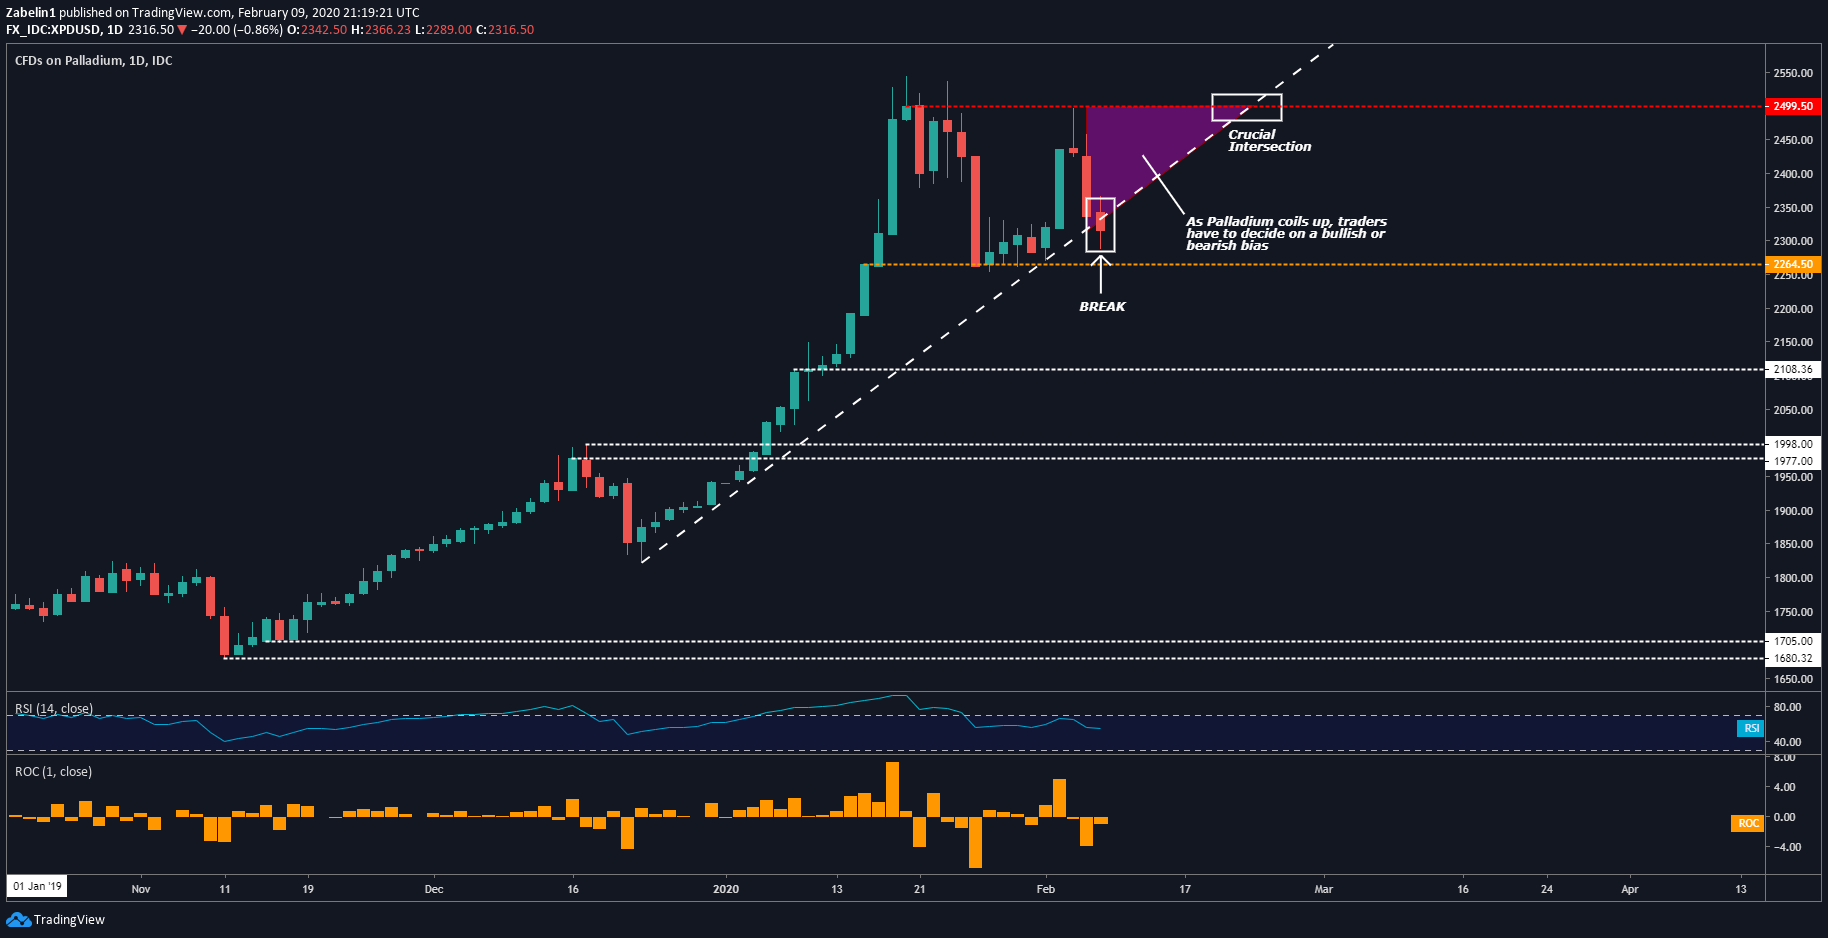
XPD/USD chart created using TradingView


It didn't raise at all that day, but after...