
Week In Review: It's Hard To Get Rich
How Much Do You Need to be Considered Rich?
This blog is mostly about building wealth. You can qualify getting rich as part of that although many bloggers try to differentiate between the two. Merriam-Webster says the two words are synonyms.
I have pointed out before the incomes and net worth needed to be in the top 10%, which are $145,135 and $1,182,390, respectively. But to get into the top 1% you need an income of $515,371 and a net worth of over $10 million. This is obviously much harder. The numbers vary if you are looking at households or individuals or means and medians. Clearly, you can probably make it to the top 10% for net worth over time. Just map out your net worth target by age and make a plan. It is possible on even an average income. I write a series on Secret Dividend Millionaires who are examples illustrating that it is possible.
It Was Easier to Get Rich in 1980
However, there is an argument to make that it is hard to get rich these days because almost everything is overvalued. Turn back the clock to 1980 and the U.S. just finished a punishing decade with inflation, oil embargos, gas shortages, a shift off the gold standard, end of the Vietnam War etc. But the seeds were sown for a long bull market. The 10-year U.S. Treasury was yielding over 15% and the S&P 500 was yielding over 5% in 1980. Simply buying a holding 10-year bonds provided returns that exceed annualized returns of the stock market over 10-years. At a 15% interest rate the modified Rule of 72 says that your income would double every 4.93 years. Even buying a basket of stocks yielding 5% at the time generated solid returns over time.
It Is Hard to Get Rich in 2021
On the other hand, the S&P 500 is now yielding a paltry ~1.4% and the 10-year bond is yielding 1.66%. Today, it is certainly hard or at least harder to get rich through bonds and stocks comparted to 1980. Bonds will not do it at current yields, and you have to be selective on the stocks you buy. Valuations are elevated if you have been following my weekly reviews which includes data on price-to-earnings ratios. No one really wants to buy overvalued stocks because total returns going forward will be low.
Other asset classes are arguably overvalued. Gold is trading $1842.90 per ounce, not far from the record last year. In 1980, the price of gold was about $600 per ounce but after adjusting for inflation the price of gold would be even higher than it is today. Both commercial and residential real estate are expensive. In 1980, the median home value was roughly $57,530 and at end of 2020 it was approximately $300,987. Housing price growth each year has mostly exceeded the rate of inflation since 1980 with the exception of the period around the sub-prime mortgage crises from 2009 to 2011. Alternative investments like bitcoin have gained an annualized return of 230% in a short time, but this is an extremely volatile and risky investment.
So, the main point is that most investment classes are trading at high valuations or near record prices. Then it follows that it will be much harder today to get rich compared to 1980. The data bears this out. The chart below shows that upward mobility has declined since 1940. At age 30, children of successive generations do not have the same income as their parents and grandparents. In otherwards it is becoming increasingly difficult to have an income greater than your parents.

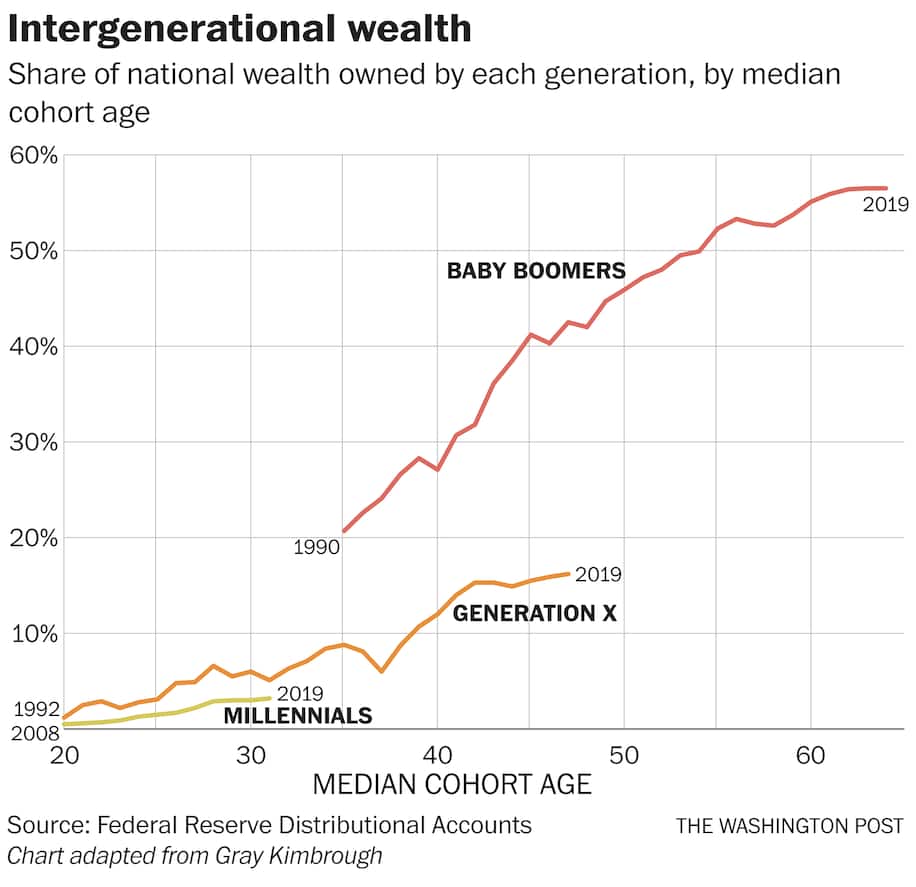
What about wealth? Well baby boomers had more wealth too than subsequent generations at least to date. Some of this is due to the difficulty of generating returns over time but some is also related to higher debt levels of younger generations. They are burdened with student loans and other debt that makes it hard to build wealth.
Final Thoughts on Is It Hard to Get Rich?
So, the answer is yes, it is hard to get rich but not impossible. It takes a certain amount of discipline. You would need to spend less than you earn, save the difference, and invest to build wealth. Relying solely on your 401(k) plan is probably not enough as the average retiree has only about $182,100 in their plan.
Chart or Table of the Week
Today I highlight South Jersey Industries (SJI). The company is a natural gas utility with regulated operations in New Jersey and unregulated operations in NJ and mostly Pennsylvania. The stock is a Dividend Contender with 15 consecutive years of dividend growth. Dividend growth has slowed in the past several years as top and bottom line growth has slowed. That being said, most operations are regulated, and the company has a slowly growing rate base that will in turn support a growing dividend. The current dividend yield is 4.7%, more than double that of the S&P 500. The utility is trading at a low valuation relative to its peers. The screenshot below is from Stock Rover*.

Source: Stock Rover*
Dividend Cuts and Suspensions List
I updated my dividend cuts and suspensions list at end of April. The number of companies on the list has risen to 521. We are well over 10% of companies that pay dividends having cut or suspended them since the start of the COVID-19 pandemic.
There were three new companies to add to the list this past month. These three companies were Acadia Realty Trust (AKR), Genie Energy (GNE), and Tri-Continental (TY).
Two companies have made additional cuts or suspended the dividend outright. This includes Antero Midstream (AM) and Geo Group (GEO).
Market Indices
Dow Jones Industrial Averages (DJIA): 34,382 (-1.14%)
NASDAQ: 13,430 (-2.34%)
S&P 500: 4,174 (-1.38%)
Market Valuation
The S&P 500 is trading at a price-to-earnings ratio of 44.3X and the Schiller P/E Ratio is at about 37.3X. These two metrics are down this past week. Note that the long-term means of these two ratios are 15.9X and 16.8X, respectively.
I continue to believe that the market is overvalued at this point. I personally view anything over 30X as overvalued based on historical data. Note that we are near or over 40X and valuation levels near the top of the dot-com era.
S&P 500 PE Ratio

Source: multpl.com
Shiller PE Ratio

Source: multpl.com
Stock Market Volatility – CBOE VIX
The CBOE VIX measuring volatility was up over two full points this past week to 18.81. The long-term average is approximately 19 to 20.

Source: Google
Fear & Greed Index
I also track the Fear & Greed Index. The index is now in Neutral at a value of 40. This is down 15 points this past week.
There are seven indicators in the index. They are Put and Call Options, Junk Bond Demand, Market Momentum, Market Volatility, Stock Price Strength, Stock Price Breadth, and Safe Haven Demand.
Junk Bond Demand is indicating Extreme Greed. Investors are accepting 1.96% yield over investment grade corporate bonds. The spread is down further from recent levels indicating that investors are taking on more risk.
Market Momentum is indicating Greed. The S&P 500 is 7.5% over its 125-day average. This is further above the average than normal over the past 2-years.
Stock Price Strength is signaling Greed. The number of stocks hitting 52-week highs compared to those hitting 52-week lows is at the upper end of its range.
Market Volatility is set at Neutral. The CBOE VIX reading of 18.81 is a neutral reading.
Stock Price Breadth is indicating Extreme Fear as advancing volume is 9.40% more than declining volume on the NYSE. Market breadth is improving but it is still near the lower end of its range.
Safe Haven Demand is in Extreme Fear. Stocks and bonds have provided similar returns over the past 20 trading days. This is close to the weakest performance for stocks over the past 2-years as investors move back into bonds.
Put and Call Options are signaling Extreme Fear. In the last five trading days, put option volume has lagged call option volume by 44.09%. This is amongst the highest level of put buying in the past two years.

Source: CNN Business
Economic News
The U.S. Bureau of Labor Statistics reported a record-high 8.12 million job openings in March. The Job Openings and Labor Turnover Summary (JOLTS) figure is the highest since measurement began in December 2000 and represents a month-to-month increase of 7.9%. Job openings were distributed across the economy, however food services and accommodation (+185,000), state and local education (+155,000), and arts and entertainment (+81,000) reported especially strong figures. Layoffs fell to a record low reading of 1.5 million, decreasing 1.0%. Hiring was up 3.7% in March, increasing to 6.1 million.
The U.S. Bureau of Labor Statistics reported consumer prices increased a seasonally adjusted 0.8% in April, the largest gain since June 2009. The all items index increased 4.2%, the largest 12-month increase since September 2008. A third of the all items increase is attributed to a 10.0% increase in the index for used cars and trucks, the largest increase since 1953. In addition, indexes for shelter, airline fares, recreation, motor vehicle insurance, and household furnishings and operations all increased. The food index gained 0.4%, up 2.4% over the past 12 months. The energy index decreased slightly as gasoline prices fell 1.4% after a 9.1% increase in March. The energy index is up 25.1% over the last 12-months. The index for all items less food and energy rose 0.9% in April, the largest monthly increase since April 1982, it is up 3.0% over the last 12-months.
The Commerce Department reported April’s retail sales were virtually unchanged from March’s revised 10.7% increase. The $619.9 billion is the highest reading yet, exceeding March’s $619.7 billion figure. The April reading is 51.2% higher year over year. Increases in auto purchases (+2.9%) and food services (+3.0%) were offset by decreases in clothing (-5.1%), sporting goods, hobby, musical instruments and book stores (-3.6%), building materials (-0.4%), and online retail (-0.6%). Consumer spending expanded at a 10.7% annualized rate in the first quarter.
Disclaimer: Dividend Power is not a licensed or registered investment adviser or broker/dealer. We are not providing you with individual investment advice on this site. Please consult with ...
more

