
Pitting The Debt To Equity Ratio To Work

The Debt to Equity Ratio is a comparison of a company’s debt (or liabilities) as compared to its equity (assets over and above liabilities), or more familiarly, its “net worth”.
Fundamental vs. Technical Analysis
When it comes to trading and investing, the length of time in an investment should be taken into consideration. For many traders, their time horizon is fairly short-term, from months to weeks to days or even for some, mere minutes or even seconds.
Most investors, on the other hand, are “in it for the long haul”. They can be in an investment for several months to many years.
The question then becomes, how do you evaluate an investment to determine if it’s a good time to buy, hold, or sell?
There are two primary ways of doing that: technical and fundamental analysis. Technical analysis looks at a company’s stock chart trying to find trends, areas of support and resistance, etc., to determine the timing of getting into (or out of) a trade.
Fundamental analysis instead focuses on the company itself: how its run (the management team), what kind of liabilities it has, the industry it’s in, prospective new or future business partnerships or opportunities, etc..
As you might imagine, the trader who is in and out of a trade in a few minutes probably has little concern over a company’s prospects 5 to 10 years out.
Likewise, an investor with a 10-year time horizon isn’t likely to be interested in a company that happens to be a good buy based on a five-minute chart if the company itself is in debt to its eyeballs and has no foreseeable prospects and half the management team is bailing ship.
Rather than one being “better” than the other, technical and fundamental analysis are partners when it comes to investing. They have an inverse relationship based on how long you expect to be in a given investment/trade.
The longer you expect to be in a trade, the more fundamental analysis “outweighs” technical analysis. Conversely, the shorter you expect to be in a trade, the more technical analysis “outweighs” fundamental analysis.
The first area we are going to investigate is the Debt-to-Equity Ratio, often abbreviated as “D/E” or “D/E Ratio”.
What is a Debt to Equity Ratio?
Simply put, the D/E Ratio is a comparison of a company’s debt (or liabilities) as compared to its equity (assets over and above liabilities), or more familiarly, its “net worth”. This is similar to personal Net Worth, which is their personal “equity” (assets minus liabilities).
However, when evaluating companies, it’s difficult to say that Company A with a “net worth” of $1 Million is any better or worse than Company B with a “net worth” of $2 Million or Company C with a “net worth” of $500,000.
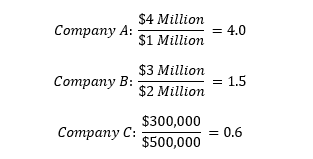
For instance, what if I told you that Company A had $4 Million in debt, while companies B and C had $3 Million and $300,000, respectively?
You would need a way to better evaluate “apples to apples”, as they say. Enter the Debt to Equity Ratio. It’s easy enough to calculate:

Now, we can compare companies A, B and C.
We can take the formula and rearrange it to figure out a company’s assets by simply adding the numerator and denominator.
Therefore, we can see that both Company A and Company B have assets of $5 Million, while Company C has assets of $800,000.
Putting the D/E Ratio to Work
From the examples above, we can see that you cannot simply look at a company’s assets, liabilities, or their equity by themselves. If all three companies were in the same industry, you might not ever consider Company C as it is less than 1/5 the size of the other two.
Yet clearly, its D/E Ratio is the lowest of the three. This means it is the least leveraged, which often means it has more ability to weather possible downturns (in the economy, the industry and/or the company itself).
However, if it’s in an industry that has an average D/E Ratio of 1.3, a ratio of 0.6 may tell you that it’s under-leveraged.
That could mean much slower growth or more inefficient use of capital as compared to other companies in that industry. In that case, Company B starts to look more favorable.
Yes, it’s more than twice as leveraged and has 10 times the actual debt, but it’s more in-line with what that industry is doing as a whole.
And while Company A and Company B both have the same amount of assets at $5 Million, it’s easy to determine that Company B would be the better choice as it’s leveraged nearly a third as much.
Caveats and Considerations
It is important to note that while the D/E Ratio is helpful in comparing companies within the same industry, the same cannot be said for companies in disparate industries.
Some industries may be capital intensive and may commonly have ratios above 1, while less capital intensive industries may be commonly less than half that. Other industries, such as utilities, have much higher ratios compared to overall market averages.
But as they are usually able to maintain a steady income stream even though they tend to grow at a slower rate, this typically represents an efficient use of capital. Also, not all liabilities are created equal.
That is to say, the risks associated with short-term debts, for instance, are not the same as the risks associated with long-term debts.
Longer-term debts are generally more risky than shorter-term debts as they are usually more expensive and more susceptible to things like changing interest rates.
Analysts also don’t always classify the same things as debt. For example, one analyst may consider preferred stock (which has a preferred dividend, par value and liquidation rights) as a liability while another considers any stock as equity.
One also needs to keep in mind that things like retained earnings/losses, pension plan adjustments and intangibles can skew the ratio.
As a result, further research may be required before a true[r] picture of a company’s liabilities can be seen.
If Less Is More, What About a Negative?
You would be right to say that, assuming the same definitions were used and the ratios were calculated with the same respective figures, a lower Debt to Equity Ratio is generally preferable to a higher one.
However, while negative numbers are technically “less” than positive numbers, when it comes to the D/E Ratio, negative numbers are something you want to avoid.
This means that the company has more liabilities than they do assets, and is often considered a very risky sign, indicating that bankruptcy may be in the [relatively near] future.
Conclusion
While there can be many considerations as to what is considered debt or a liability, or which liabilities to include, the actual calculation of the Debt to Equity Ratio is straightforward. So long as you are including (or not) the same respective figures, it gives you a number that helps compare companies on an even playing field.
Different industries have different “standards” when it comes to the use of leverage, so as a metric, it should only be used to compare companies within the same industry.
While not used as a sole indication of a company’s value or strength, it is a good indication of the company’s use of leverage.
This can be useful in determining whether or not a company makes it into an investor’s portfolio.
Disclosure: Download the Options Trading 101 ...
more

