
Dissecting The Covered Strangle

The covered strangle strategy is a bullish strategy that involves being long 100 shares of stock and selling an out-of-the-money call and an out-of-the-money put. You can also think of it as a covered call with an extra short put.
The strategy is called a covered strangle because the call side of the strangle is “covered” by the long 100 shares.
A normal short strangle has unlimited risk, but in the case of the covered strangle the naked call risk is eliminated by the 100 long shares.
A covered strangle is set up as follows:
Long 100 shares
Short 1 OTM call
Short 1 OTM put
The strategy is structured so that the investor can sell their shares at a higher price, but they are also willing to buy more shares at a lower price.
This is very similar to Step 2 in our Wheel Strategy.
Let’s look at an example that we will discuss in this article.
Date: October 21, 2020
Current Price: $116.87
Trade Set Up:
Buy 100 AAPL Shares @ $116.87
Sell 1 AAPL Jan 15th, 2021 125 call @ $5.90
Sell 1 AAPL Jan 15th, 2021 105 put @ $4.30
Net Cost: $10,667
Maximum Loss: $21,167
Maximum Profit: $1,833
Breakeven Price: $106.67
Decrease To Breakeven Price: -8.73%
Return Potential: 8.66%

We can see above that covered strangles are positive delta (bullish), negative gamma, negative vega (short volatility) and positive theta (benefit from time decay).
Very bullish traders would place the short call further OTM. Less bullish traders would place the short call closer to the stock price.
Maximum Profit
The maximum profit for a covered strangle is equal to the distance between the stock price and the short call strike, plus the premium received.
In our AAPL example that is equal to $1,833.
This is calculated as:
Short call strike (125) – Stock Purchase Price (116.87) + Strangle Credit Received (10.20) x 100.
Maximum Loss
The maximum loss for a covered strangle is equal to the cost of the trade plus the risk from the extra short put.
In our AAPL example, the trade cost $10,667. We also have an extra risk of $10,500 from the short put ($105 strike price x 100). Therefore, in this case the maximum loss is $21,167.
Here is the formula to calculate the maximum loss:
In our AAPL example, this can be calculated as:
(116.87 + 105 – 10.20) x 100 = $21,167
Breakeven Price
The breakeven price for a covered strangle is easy to calculate. In our AAPL example this can be calculated as:
(116.87 – 10.20 ) x 100 = $106.67
Let’s assume that AAPL stock finishes exactly at $106.67 at expiry and prove it out.
The $125 strike call is out-of-the-money and will expire worthless.
The $105 strike put is also out-of-the-money and expires worthless.
The loss on the 100 shares is $10.20, BUT we have received and kept $10.20 in option premium, so the position is exactly breakeven.
With a covered strangle, the trade will profit provided that any loss on the share position is not greater than the premium received for selling the call and put.
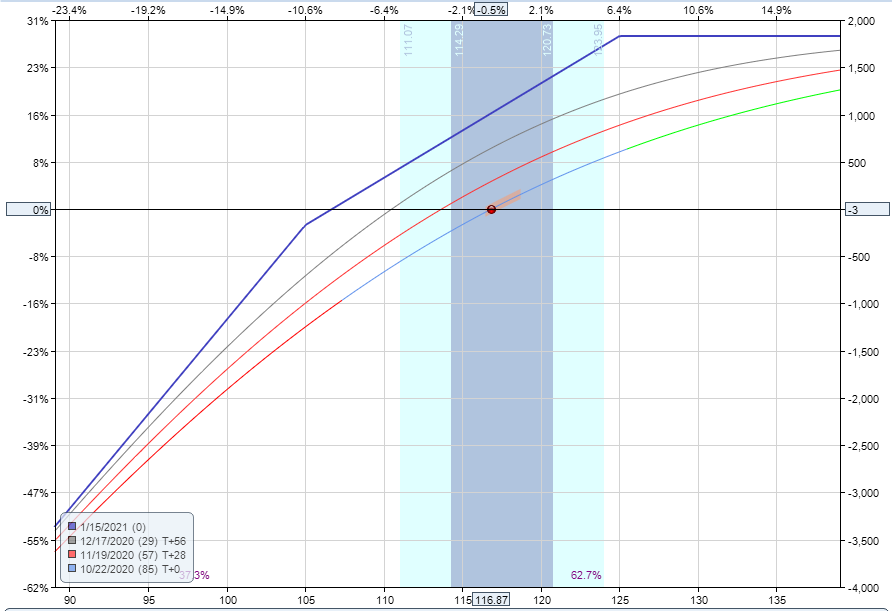
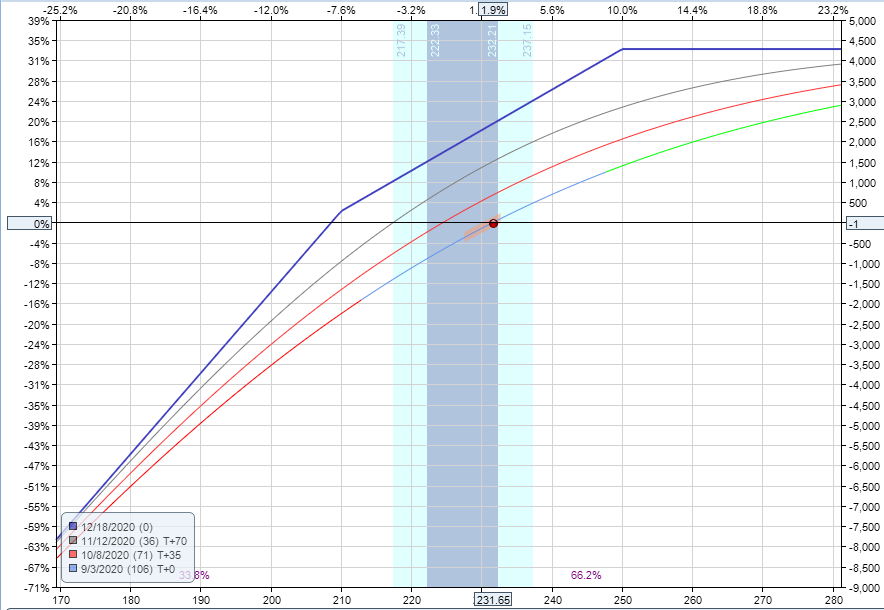
Payoff Diagram
The payoff diagram is like that of a covered call, with one main difference. You may have noticed that the loss starts to pick up steam once the stock price breaks below the short put strike.
This is where the covered strangle has extra risk compared to a covered call because the extra short put means the trader is on the hook to purchase another 100 shares of stock if called upon to do so.
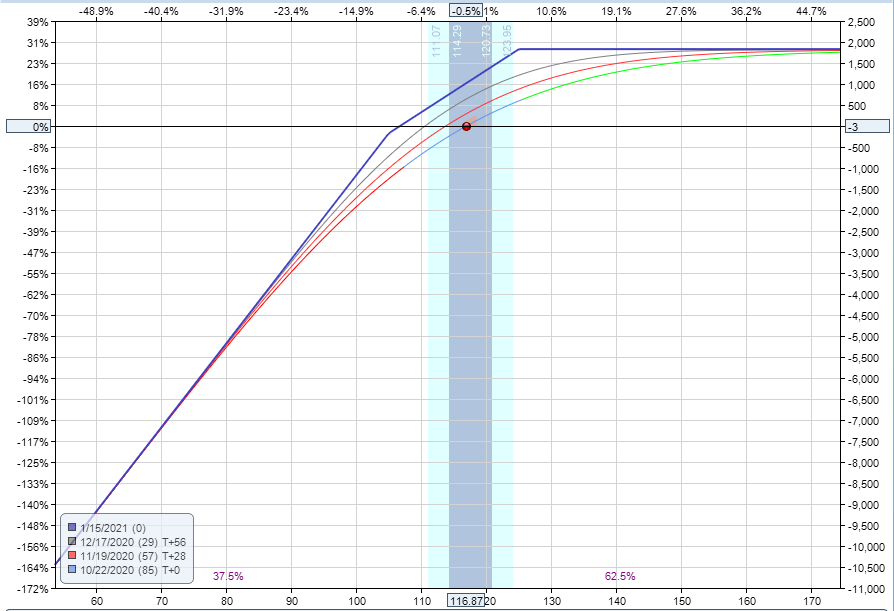
Let’s look at a zoomed out picture of the payoff graph to see how it looks.
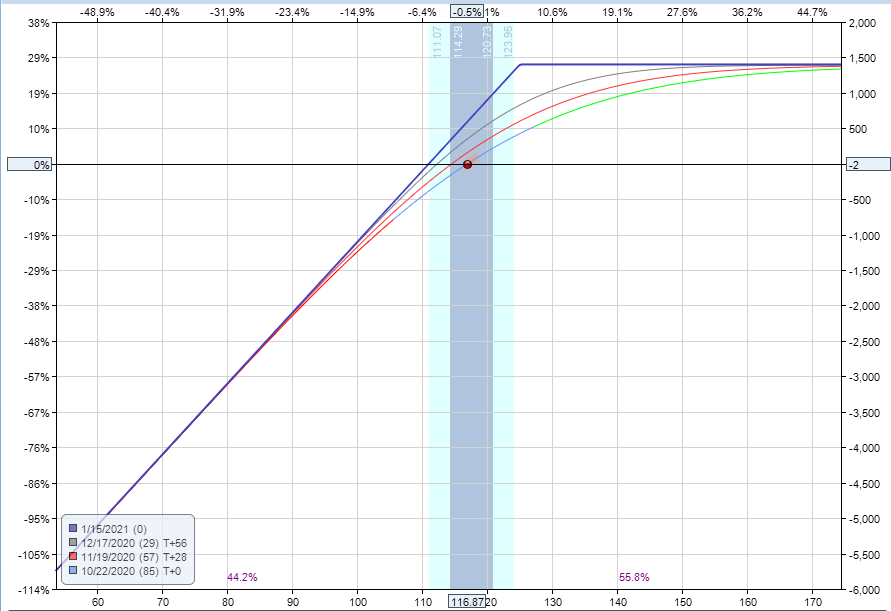
Let’s compare that with a regular covered call where the downside loss potential is much less.
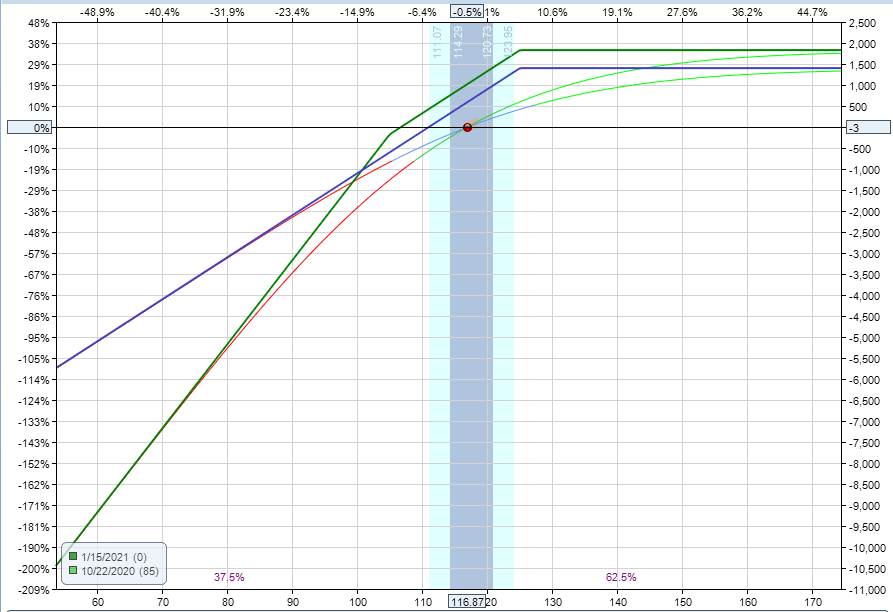
For this reason, a covered strangle is considered more bullish than a covered call.
We can also see this in the delta of the two positions. The covered strangle has a delta of 86 whereas the covered call has a delta of just 59.
Here we can see the two payoff graphs together with the covered strangle in green and the covered call in blue.
Risk of Early Assignment
There is always a risk of early assignment when having a short option position in an individual stock or ETF.
You can mitigate this risk by trading Index options, but they are more expensive.
Usually, early assignment only occurs on call options when there is an upcoming dividend payment. Traders will exercise the call to take ownership of the share before the ex-date and receive the dividend.
Short puts can also be assigned early.
The important thing to be aware of is that early assignment generally happens when a short option is in-the-money with little time value left.
How Volatility Impacts The Covered Strangle
Covered strangles are short vega trades, so generally speaking, they benefit from falling volatility after the trade has been placed. Vega is the greek that measures a position’s exposure to changes in implied volatility. If a position has negative vega overall, it will benefit from falling volatility.
If the position has positive vega, it will benefit from rising volatility. You can read more about implied volatility and vega in detail here.
Looking at the AAPL example above, the position starts with a vega of -40. This means that for every 1% fall in implied volatility, the trade should gain $40.
The opposite is true if implied volatility rises – the position would lose $40.
Delta is going to be the main driver of profits or losses in this trade, vega will only have a small impact initially. Changes in implied volatility have no impact on the profits or losses at expiration.
How Theta Impacts Covered Strangles
Covered strangles are positive theta trades in that they make money as time passes, with all else being equal. Theta is at its highest when the stock is between the short put and short call.
The ideal scenario for the trade is that the stock trades up towards the short call strike at expiration and both the call and the put expire worthless.
Other Greeks
DELTA
Covered strangles are bullish trades and have positive delta. The delta will always be positive no matter what stage of the trade you are in or how it is set up.
The trade does well when the stock prices rises. Pretty obvious, right?
In our AAPL example, the trade had delta of +86 meaning the initial position is roughly equivalent to owning 86 shares of AAPL stock. This delta figure will fluctuate as the stock moves.
As the stock moves higher, the delta will fall. As the stock moves lower, the delta will increase.
If the stock is below the short put strike at expiration the short put will have delta of +100 and the short call will have delta of 0 (i.e. it expires worthless).
Therefore, the maximum delta of the trade is +200 and will occur at expiration if the stock is below the short put strike.
GAMMA
Covered strangles have negative gamma. Gamma is one of the lesser known greeks and usually, not as important as the others. Gamma is not a major driver of profits and losses in this type of trade.
Risks
It goes without saying that as a bullish trade, we have a risk that the price of the underlying will fall sharply causing an unrealized loss, or a realized loss if we close the trade.
Some other risks associated with covered strangles:
ASSIGNMENT RISK
We talked about this already so won’t go into too much detail here and while this doesn’t happen often it can theoretically happen at any point during the trade. The risk is most acute when a stock trades ex-dividend.
If the stock is trading well below the sold call, the risk of assignment is very low. E.g. a trader would generally not exercise his right to buy AAPL at $125 when AAPL is trading at $120 purely to receive a $0.50 dividend.
The risk is highest if the stock is trading ex-dividend and the short call is in the money.
The short put contains assignment risk but will generally only be assigned when the put is in-the-money and there is little time value left.
One way to avoid assignment risk is to trade stocks that do not pay dividends or trade indexes that are European style and cannot be exercised early. However, this should not be the primary factor when determining which underlying instrument to trade.
Trade Management
As with all trading strategies, it’s important to plan out in advance exactly how you are going to manage the trade in any scenario. What will you do if the stock rallies? What about if it drops? Where will you take profits? Where and how will you adjust? When will you get stopped out?
Lots to consider here but let’s look at some of the basics of how to manage covered strangles.
PROFIT TARGET
First and foremost, it’s important to have a profit target.
Will you hold the trade until expiration, or will you close it early if the stock has rallied and the majority of the profits have been achieved? That’s the first decision. You can refer to my guide on covered call exit strategies for some ideas.
STOP LOSS
Having a stop loss is also important, perhaps more so than the profit target. With covered strangles, you can set a stop loss based on a percentage of the capital at risk.
Some traders like to set a stop loss at 20% of capital at risk. Others might close if the stock has dropped 8-10% below the short put strike. Others will view this as more of a long-term strategy and will hold on to the stock no matter what.
Whatever you decide, make sure it is written down and mapped out in your trading plan.
Examples
Let’s follow our AAPL example through to expiration and see how it performed.
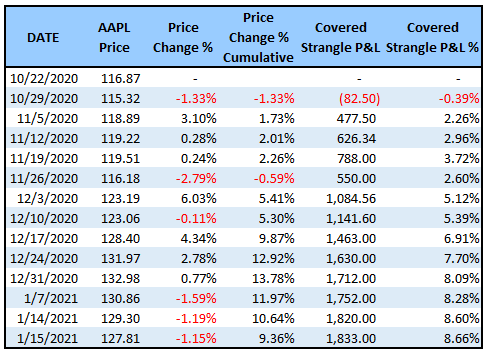
Above we can see that the trade was profitable almost from day one and closed with the maximum potential gain when the stock finished above the short call strike at expiration.
On December 24th, about three weeks out from expiration, the majority of the profits had been received. The trade could have perhaps been closed early and this point and the capital redeployed elsewhere.
The covered strangle slightly underperformed pure stock ownership.
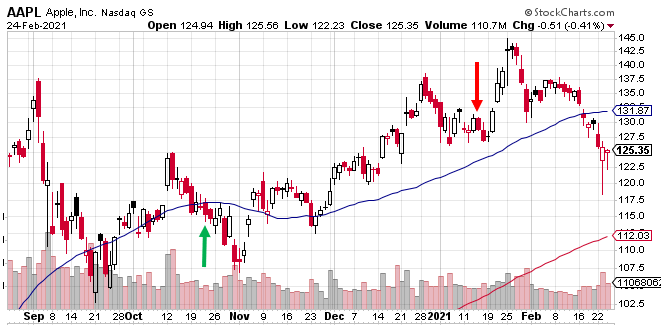
Here you can see the trade entry and exit points on the chart.
That was a nice easy trade, let’s look at another example.
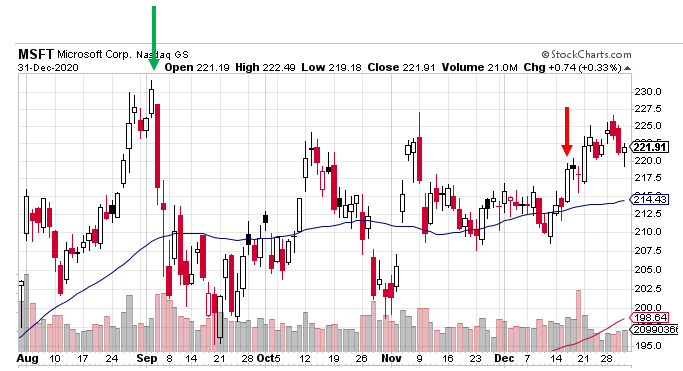
Let’s assume someone tried this trade on MSFT right at the high made in early September.
Date: September 2, 2020
Current Price: $231.65
Trade Set Up:
Buy 100 MSFT Shares @ $231.65
Sell 1 MSFT Dec 18th 250 call @ $13.45
Sell 1 MSFT Dec 18th 210 put @ $11.02
Net Cost: $20,718
Maximum Loss: $41,718
Maximum Profit: $4,282
Breakeven Price: $207.18
Decrease To Breakeven Price: -10.56%
Return Potential: 10.26%

Let’s follow this trade through on a weekly basis to see how it performed.
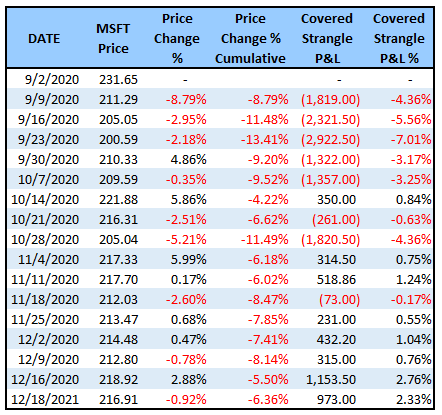
Here we can see that the trade was under pressure right from the start but ended up with a gain of 2.33% even though MSFT stock was -6.36%.
Here are the entry and exit points on the chart:
Let’s now look at an example where the stock finishes well below the sold put so we can see how the strategy performs when the stock takes a big dive.
We’ll use Boeing (BA) stock right before the coronavirus pandemic:
Date: March 6, 2020
Current Price: $258.12
Trade Set Up:
Buy 100 BA Shares @ $258.12
Sell 1 BA May 15th 290 call @ $13.45
Sell 1 BA May 15h 230 put @ $15.50
Net Cost: $22,917
Maximum Loss: $45,917
Maximum Profit: $6,083
Breakeven Price: $229.17
Decrease To Breakeven Price: -11.22%
Return Potential: 13.25%
Let’s see how this one worked out:
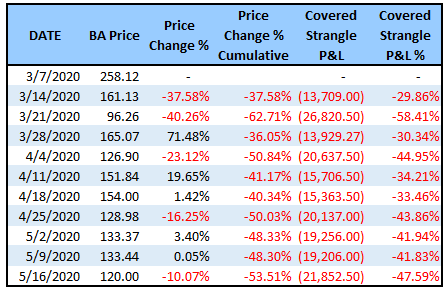
This trade, entered at exactly the wrong time, was under pressure right from the start.
Hopefully, having a stop loss would have seen the trade avoid big losses in this case, but it’s good to see what can go wrong.
Here are the entry and exit points:

Worth noting here is that if the investor stuck with the trade and held on to the 200 shares of BA stock, then it did get back above the breakeven price of 229.17 in early June.
Summary
Covered strangles are an options strategy that involves being long 100 shares and simultaneously selling an OTM call and an OTM put. The trade will do well in neutral to slightly bullish markets but will underperform in strong bull markets as the potential gains are capped by the short call.
Covered strangles will outperform being long 200 shares in strong bear markets, but will still suffer large losses.
Disclaimer: The information above is for educational purposes only and should not be treated as investment advice. The strategy presented would not be suitable for investors who are ...
more

