
Context For 2021’s Stretched Sentiment
We're three weeks removed from New Year's Day, a time when the weaker New Year's resolutions start to fall by the wayside. But there's still a "buzz" to 2021, thanks to President-elect Joe Biden's seamless inauguration and the ramped-up vaccine efforts many are hoping will come along with the new administration. The Dow, S&P 500, and Nasdaq all boast very muted gains to start 2021, yet, as we're about to see, investor optimism is filled to the brim. To help articulate the current investing climate, some context was needed to help frame just how hopeful investors are for the coming year.
Let's take it back to December 31, 2019, the last trading day of the year. Major benchmarks were at record highs, the coronavirus was but a whisper, and the U.S. economy was chugging along. Per the table below –courtesy of Schaeffer's Senior Quantitative Analyst Chris Prybal -- the 10-day buy-to-open equity-only put/call volume ratio sat at 0.42 at the International Securities Exchange (ISE), Cboe Options Exchange (CBOE), and NASDAQ OMX PHLX (PHLX). That's a reading that registers in the lower rungs of the last four years. There was no reason to believe 2020 would be any different than 2019.
Fast forward to December 31, 2020, a year later –even though it felt like a decade -- and that ratio sat at 0.35 after earlier bottoming off record low levels. So even after all of the volatility, the economic collapse, and a V-shaped rally, investor optimism ended 2020 at even higher levels than it did a year ago. The Options Clearing Corporation (OCC) all-exchange, equity-only, 10-day option put/call volume ratio was also lower year-over-year. As 2020 ended, this ratio even dipped below 0.50 for the first time ever. In short, options traders have been picking up calls at a rapid rate heading into the new year.
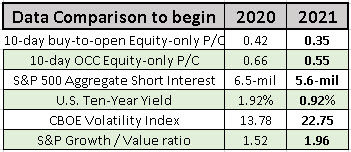
It's not just options traders though; short interest has tapered off year-over-year, while the U.S. 10-year Treasury yield has shed an entire percentage point in the last 12 months. The only increase in the past year has been the Cboe Volatility Index (VIX), which went from a snooze-worthy 13.78 to a more apt 22.75. So, even as the "fear gauge" hints at greater volatility, investor optimism is ramping up compared to last year.
The last column should raise eyebrows. The S&P Growth/Value ratio sat at a middling 1.5 as 2019 came to a close. An unprecedented and highly publicized 12 months then occurred for growth stocks, which saw the ratio balloon alongside the SPX but then roll over and seemingly limp into 2021, even while the SPX retained its strength. While it's still modestly above its December 2019 reading, the G/V ratio now appears stuck between that 1.5 and 2.0 channel, but in danger of testing that lower rung. With investor optimism rising, this ratio will be a fun one to, watch in 2021.

One last note regarding investor optimism. Yesterday the National Association of Active Investment Managers (NAAIM) weekly survey came in at 106.76, the third-highest reading of all time. For context, the highest reading 2020 earned all year came in at 106.74. As Schaeffer's Senior Market Strategist Matthew Timpane pointed out, the two highest readings came in October and December of 2017.
You can hardly fault investor optimism for rising the way it has, given the year we all just endured. But as Timpane noted, we've been through these peaks and troughs before. The best course of action is to acknowledge the optimism, not get swept up into it. This is done by letting price action guide your decisions and utilizing options that put less dollars at risk relative to equities.


