
Options-Based ETPs Gaining Favor
Remember alternatives? In this era of roaring beta, you’d be forgiven if you don’t. Alts, as they’re known, were supposed to provide portfolio diversification and minimize risk. And they did. Or they do. The trouble is that alt returns couldn’t compete with beta. Market-beating returns are not what these are designed to do, but it’s a tough sell to a client who has seen 10 years of double-digit gains in the broader indexes. That doesn’t mean alts are at a standstill, though.
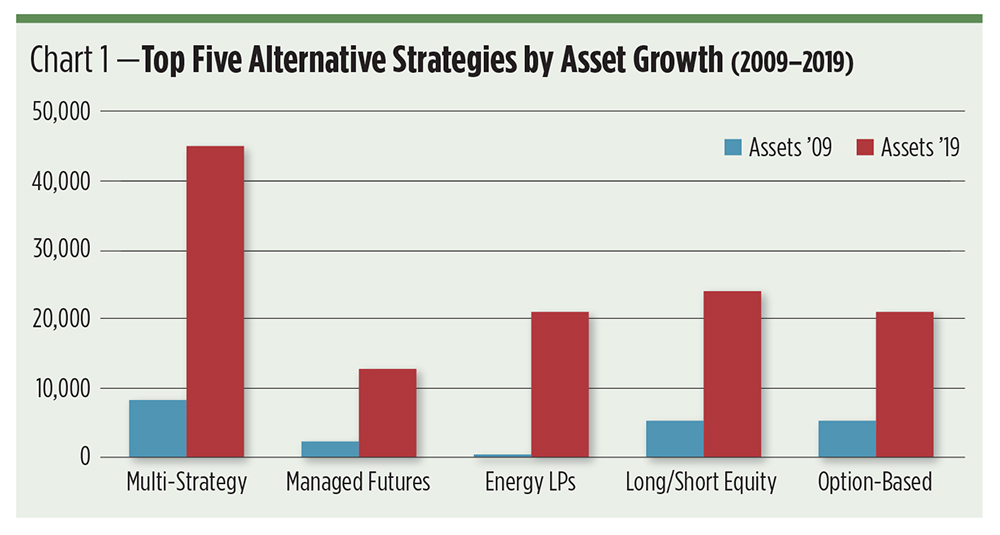
Over the previous 10 years, assets invested in alt strategies have grown 160% to more than $476 billion. Of the 14 categories tracked by Morningstar, only two—multicurrency strategies and bear market funds—lost assets. The rest grew anywhere from 0 to 449%. (See Chart 1 for the top performers.) Multistrategy products grew most, a not-altogether surprising development. Assets in these funds seem the stickiest, largely due to the durability engendered by the portfolios’ diverse exposures. Single-strategy alts tend to cyclically fall in and out of favor.
(Click on image to enlarge)
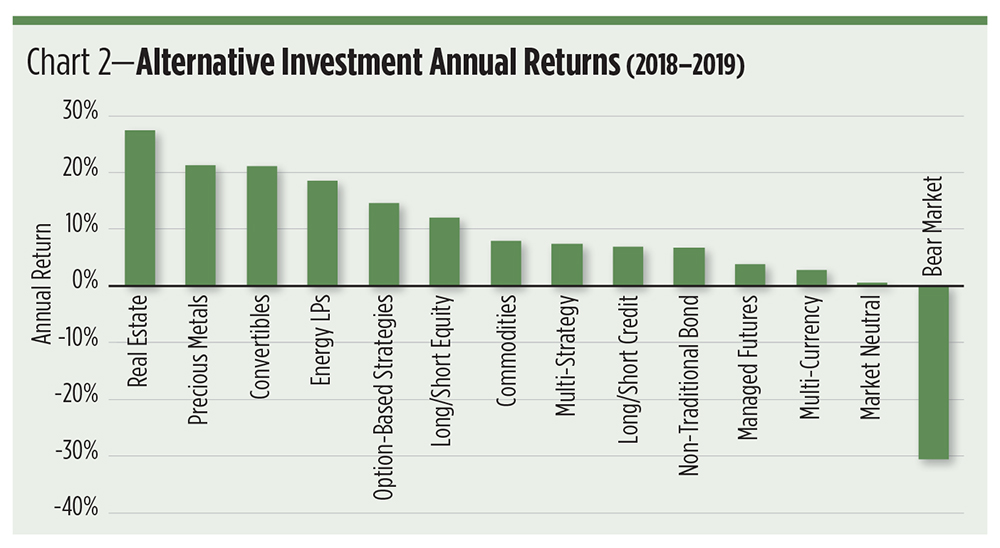
In 2019, for example, just six alt classes grew their asset bases year over year: precious metals, real estate, option-based strategies, convertibles, commodities, and market-neutral products. These funds notched an average return near 16%, just half of the gain realized by the S&P 500. Individually, few of these asset classes got close to the return of the blue-chip equity benchmark. Real estate, with its 27% return, did the best while market-neutral funds barely tipped over the positive threshold with a 0.5% gain.
More telling is the interplay of fund flows and asset growth for these funds. Two classes—option-based and market-neutral strategies—notched statistically significant positive ratios for 2019. Fund flows represent net cash inflows and outflows without regard to portfolio performance. As such, flows better reflect investor sentiment.
What makes option and market-neutral plays attractive? The answer largely depends on how they are employed. Are they additive to a portfolio or do they replace core positions? Here, we’ll drill down to the option-based strategies since we touched on market-neutral strategies in a July 2019 article.
(Click on image to enlarge)
Lots of “Options”
There’s a clear divide in the exchange-traded product universe. Go through the list of option-based ETPs and you’ll see a great number of equity covered call strategies. Stock-centric covered calls bestow positive if attenuated, beta, so most earn high r-squared coefficients versus the S&P 500.
Alts’ raison d’être is diversification—but there’s very little diversification derived from equity buy-write plays. On average, they cranked out a 90.18 r-squared coefficient over the previous 12 months.
Buy-writes on nonequity assets—gold, silver and crude oil—diverge from the benchmark to a much greater degree. These commodity-based portfolios averaged a 26.02 r-squared reading. The takeaway? Equity-based covered call ETPs are suitable as replacements for core equity positions in portfolios, not alpha-seeking satellites. Nonequity buy-writes, on the other hand, fill the bill as true alternative investments. Most can be added to an equity-loaded portfolio to yield a diversification benefit.
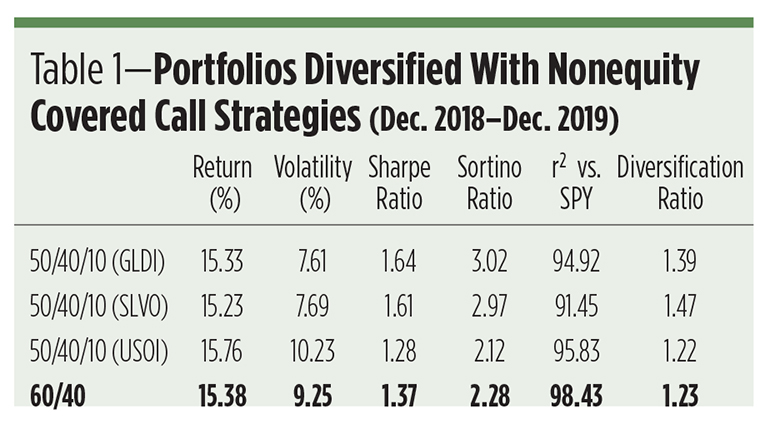
This can be seen when comparing a classic “60/40” asset mix (60% equities, 40% fixed income) to portfolios augmented with alts. An allocation to precious metal buy-writes as small as 10% would have produced significant diversification benefits over the past 12 months. The measure of these benefits is taken by the diversification ratio, a quotient derived by dividing the summed weighted risks of a portfolio’s components by the portfolio’s overall risk. The greater the ratio, the more diversification is obtained.
Equity covered call ETFs, stitched into a mix of the SPDR S&P 500 Trust (SPY) and the iShares Core U.S. Aggregate Bond ETF (AGG) provide no appreciable diversification benefit beyond the 1.23 ratio earned by the classic 60/40 portfolio. The average diversification ratio of equity covered call-enhanced portfolios was 1.25 last year.
The higher diversification ratio—1.47—would have been obtained with a 10% allocation to the Credit Suisse X-Links Silver Shares Covered Call ETN (SLVO), a note that tracks a nominal portfolio made up of iShares Silver Trust (Nasdaq: SLV) shares overwritten with a series of out-of-the-money calls. SLVO’s sibling, the Credit Suisse X-Links Gold Shares ETN (GLDI), adds nearly the same degree of diversification (see Table 1).
(Click on image to enlarge)
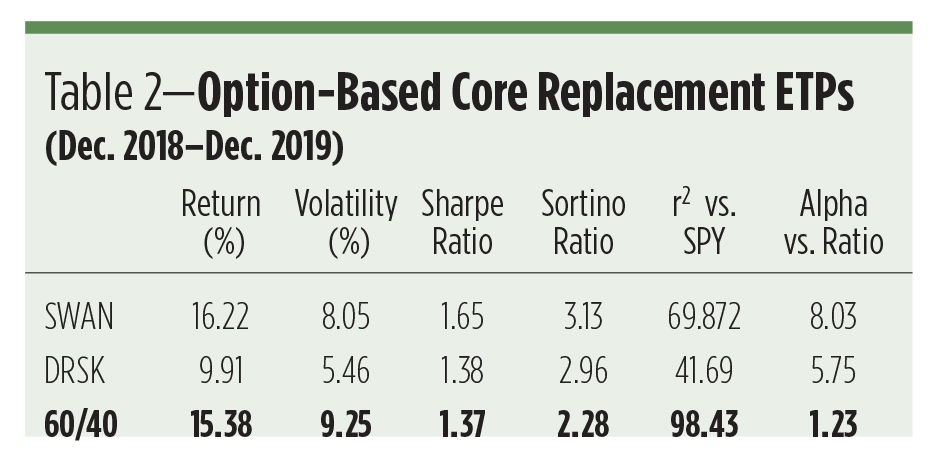
Other option-based ETPs employ different strategies. The Amplify BlackSwan Growth & Treasury Core ETF (SWAN), for example, aims to supplant a 60/40 portfolio altogether by investing in long-dated in-the-money SPY calls and U.S. Treasury obligations averaging 10 years to maturity. The portfolio’s option position aims for 70% exposure—upside and downside—to the S&P 500, while its Treasury side is intended to provide additional downside protection.
A similar approach is taken by the Aptus Defined Risk ETF (DRSK). The Aptus portfolio is dominated by a ladder of “bullet maturity” ETFs on investment-grade corporate bonds spiced with call options on a handful of U.S. large-cap stocks and/or equity ETFs.
SWAN and DRSK are designed to replace, rather than augment, a core portfolio. SWAN, because of its reliance on S&P 500 LEAPS, comes closer to replication of the classic SPY-based asset mix, but over the previous 12 months both ETFs earned alpha in excess of that netted by the 60/40 portfolio.
Then there’s the universe of the Innovator Defined Outcome ETFs, from Innovator Capital Management. These funds advertise access to capped equity market growth buffered against defined levels of loss. Five indices are targeted, specifically the price return versions of the S&P 500, the Nasdaq-100, the Russell 2000, the MSCI Emerging Market Index and the MSCI EAFE Index. The vast majority of extant products—27 of 35—are focused on the S&P benchmark.
The guts of the Innovator funds are collar strategies, combinations of out-of-the-money calls and puts bracketing an in-the-money call. The out-of-the-money contracts set the thresholds for caps and buffers to kick in. Since the options are held to expiration, the funds’ advertised outcomes may only be realized if investors hold shares from the first day of the annual outcome periods through the last day. Buying into the funds between annual resets could result in distinctly different results.
Three different buffers are on offer for the Innovator S&P 500 series. Downside potection for the “Buffer” funds kicks in after a 9% loss from the opening day’s index. For “Power” funds, the threshold is 15%; it’s 30% for “Ultra” funds.
At a time when beta is so profitable, hedges can seem very expensive. And indeed, the collars imposed on S&P 500 returns by the Innovator funds cost investors significantly in terms of gross and risk-adjusted returns.
Graphed in Chart 3 is the 2019 track record of the January series of defined outcome ETFs: the Innovator Buffer S&P 500 ETF (BJAN), the Innovator Power Buffer S&P 500 ETF (PJAN) and the Innovator Ultra Buffer S&P 500 ETF (UJAN). Plainly evident is the underperformance of the hedged portfolios compared with SPY. This doesn’t represent a failure of the collar strategy. To the contrary, that’s the result that should be expected when the underlying market appreciates so dramatically.
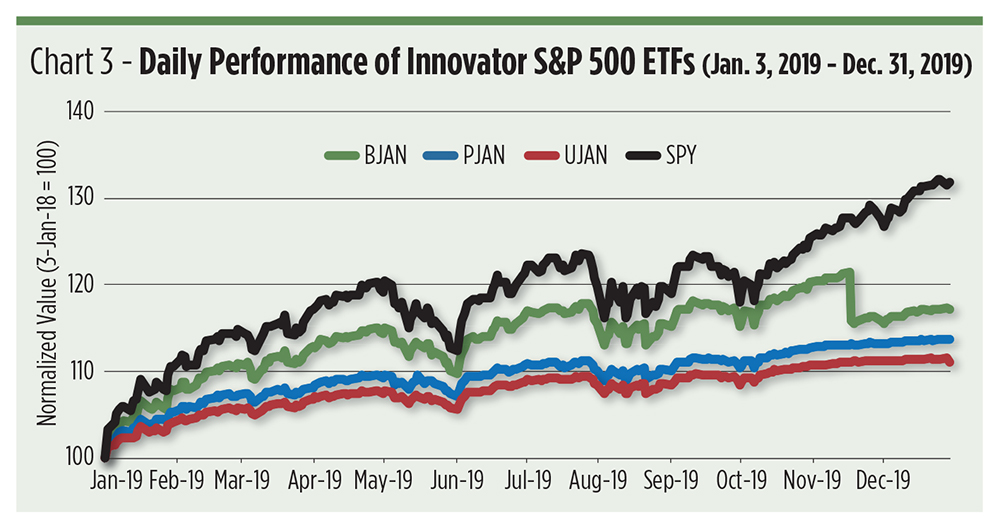
Still, these funds are bullish—to varying degrees. BJAN racks up a 0.66 beta, while PJAN and UJAN earn 0.34 and 0.30 stats, respectively. Collars aim to take a piece out of the middle of the underlying market’s return. There’s no doubt that these funds did just that. Their value is likely to be better recognized when S&P volatility dramatically increases.
(Click on image to enlarge)
The Bottom Line
At the risk of sounding punnish, all of these option-based strategies—covered call ETPs, core replacements and defined risk funds—afford investors “options”. Specifically, they give nervous asset owners ways to stay in the market rather than being sidelined in cash.
Advisors can tailor the exposures in their client’s portfolios to suit their risk tolerances and market conditions. Since the future can’t be known, the most prudent action an investor can take is to construct an asset mix capable of absorbing whatever the market offers—good or bad. In these fraught times, it is no surprise that investors and their advisors are taking another look at alts.
Disclosure: None.


