
OFLX Delivers Some Great Volume Price Analysis Lessons
The daily and weekly charts for Omega Flex (OFLX) present some fantastic volume price analysis lessons which can be applied to other markets and instruments.
If we start with the daily chart, as always, it is the congestion phases that are the breeding ground for subsequent trends to develop, and in December 2019 we saw some classic accumulation on ultra high volume and associated with narrow spread candles. Once this phase of price action was complete the initial trend then developed moving firmly away from the volume point of control at $53.80 and driving the stock up to the next level at $64.
(Click on image to enlarge)
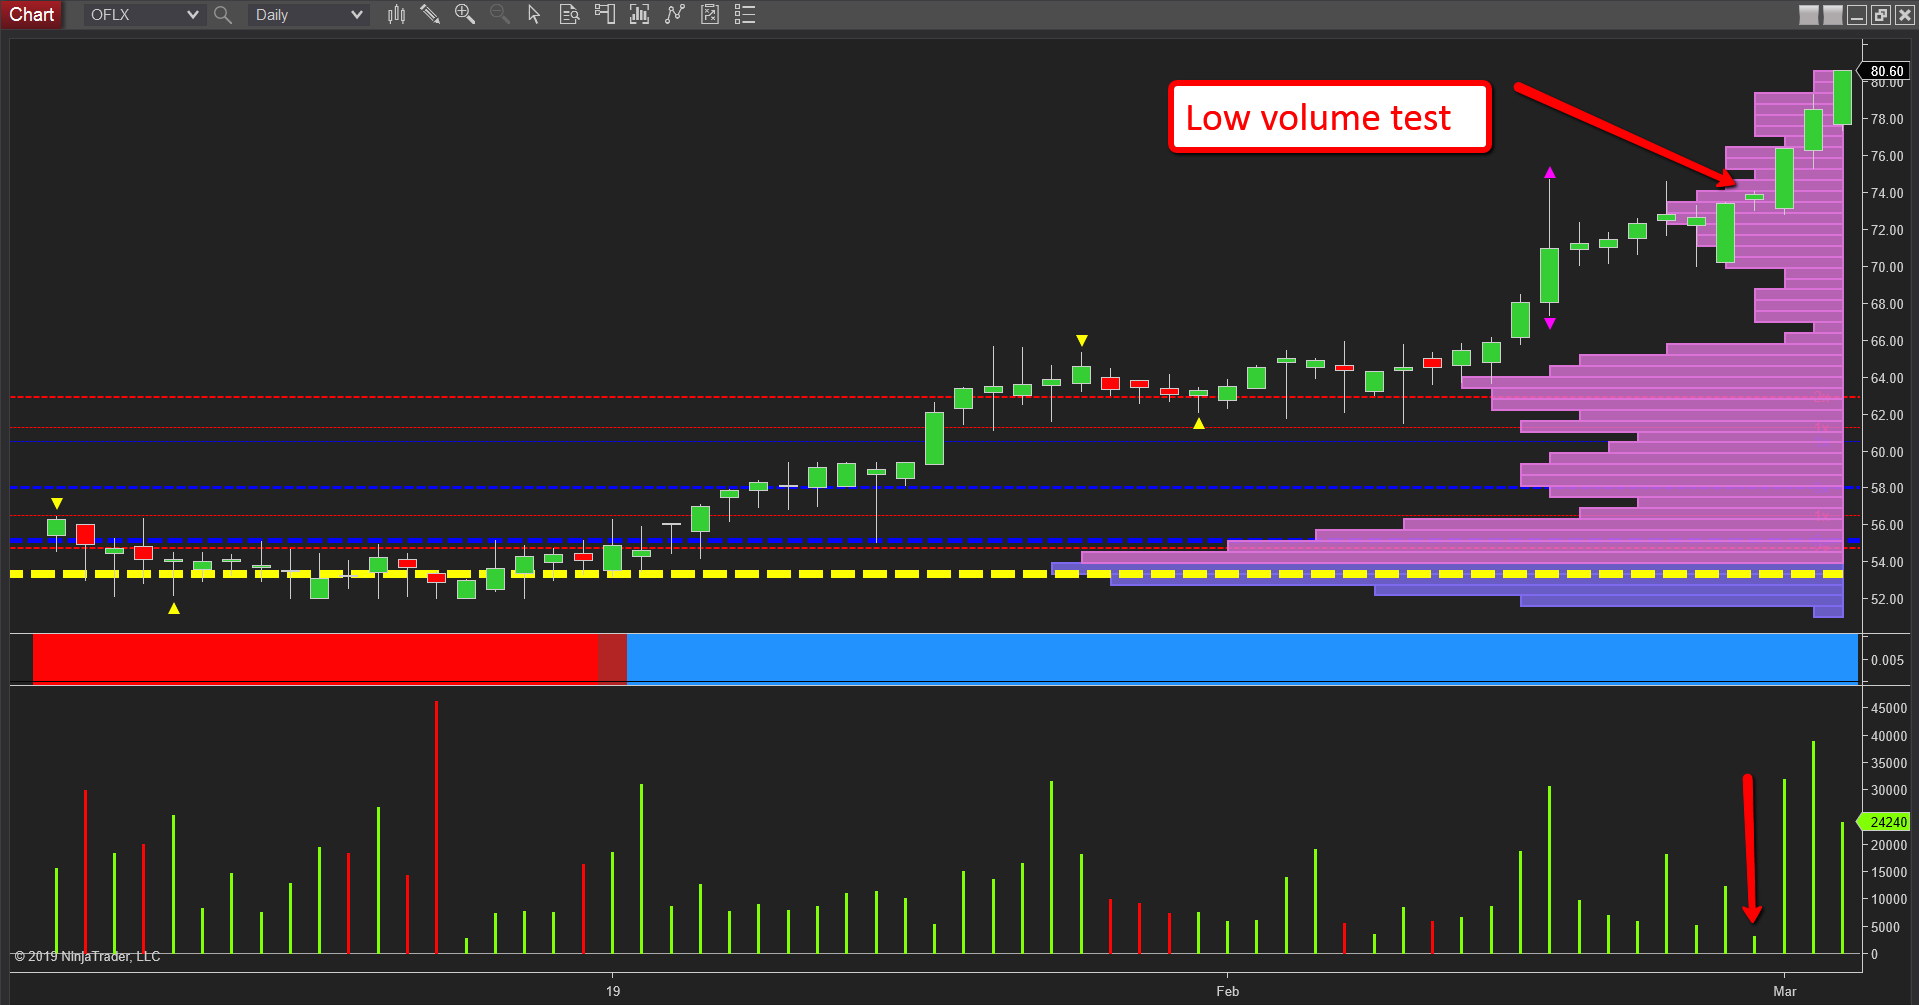
Once again we saw classic buying appear on each minor reversal lower and indeed the lack of selling pressure was also reinforced by some low volume down candles. The breakout in mid-February was associated with rising volume confirming the strength of the move but came to a halt on the volatility candle with high volume. This is almost always a precursor to a period of congestion which was indeed the case here as the price action retreated to within the spread of the candle. The interesting point to note here is the final candle of February which was a low volume test. In such tests, the price action moves lower and provided no heavy selling hits the market the test is considered a success and the price can advance further. Over the last three days, we have seen the stock advance from $73.80 all the way to $80.60 on excellent volume.
(Click on image to enlarge)
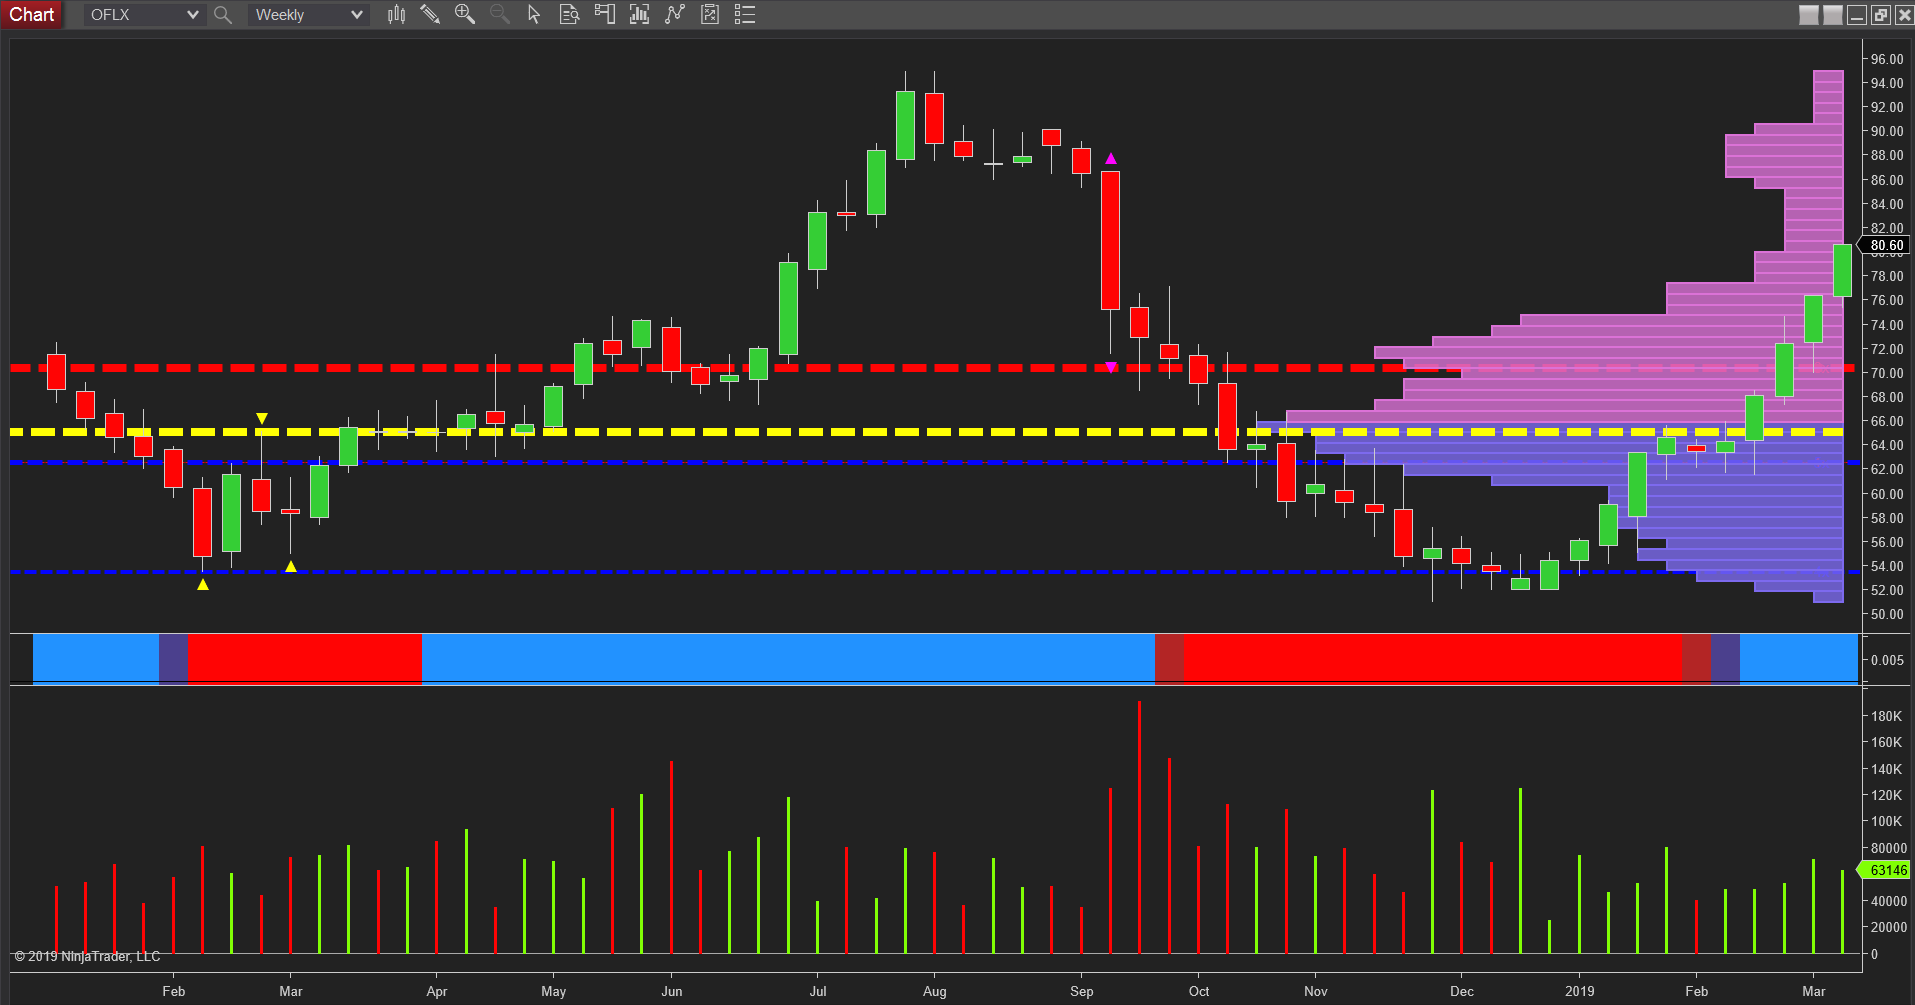
For a view as to where the stock is likely to be heading we need to consider the weekly chart and here the good news for this stock is the current price action is approaching a low volume node between $82 and $86 before we run into both price congestion and some deeper volume congestion which extends through to $90 and beyond. However, should the next few weeks of price action be associated with strong and rising volume there is no reason to suppose that this stock cannot regain the highs of July 2018 when it touched $95.
Disclaimer: Futures, stocks, and spot currency trading have large potential rewards, but also large potential risk. You must be aware of the risks and be willing to accept them in order to invest in ...
more

