
Numbers For The Innumerate
A reader writes:
I think, however, there is a need to more closely examine the overheating of the economy and paths and timing of unwind, for example. As you’ll recall, I argued that the economy was under suppression, not recession, and that’s proving right. So we’re seeing a kind of overheating I can’t recall since maybe the late 1960s or 1970s.
The economy might overheat, and overheat substantially. However, so far as measured by the CPI inflation, it hasn’t, as shown by Figure 1.
(Click on image to enlarge)
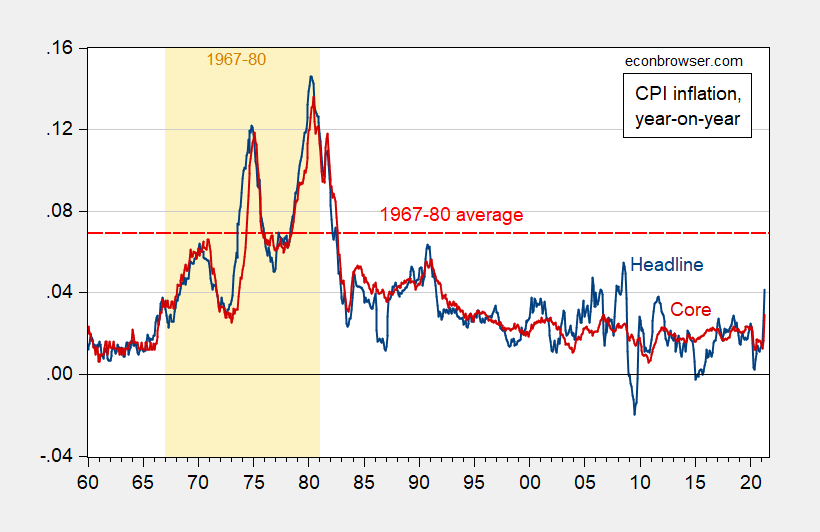
Figure 1: CPI-all inflation (blue), and CPI core inflation (red), year-on-year. 1967-80 average inflation red-dashed line. Source: BLS via FRED and author’s calculations.
As the figure clearly indicates, the latest (high) read of 4.2% inflation is still well below the 1967-80 average of 6.9%. Further note that one year ahead expected inflation is at most 3.4% (consumer survey based), and 2.4% for professional forecasters.
The CPI is an upwardly biased measure of inflation, and the Fed focuses more on the personal consumption expenditure (PCE) deflator inflation. Inflation so measured looks like this (through March, rather than April):
(Click on image to enlarge)
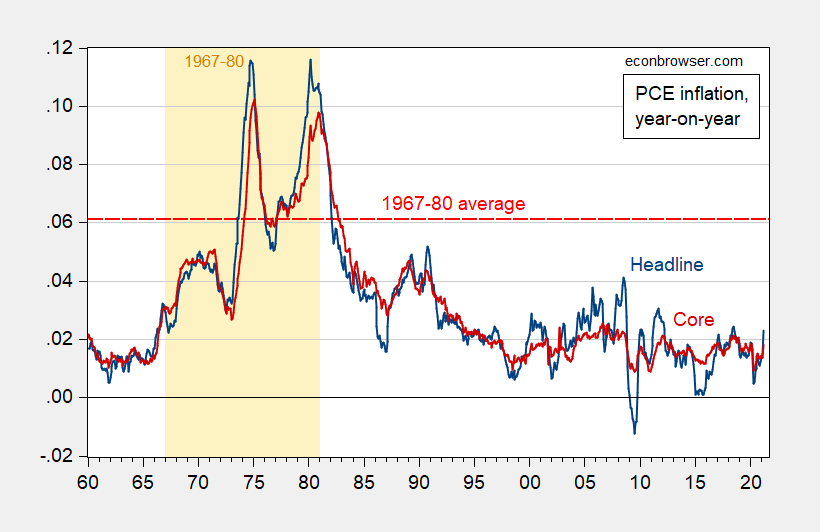
Figure 2: PCE-all inflation (blue), and PCE core inflation (red), year-on-year. 1967-80 average inflation red-dashed line. Source: BLS via FRED and author’s calculations.
On average over the past two decades (2000 onward), the PCE y/y inflation has averaged 0.3 percentage points slower than CPI y/y inflation. If that holds true for 2021M04, then the April observation for PCE inflation will be 3.9%. Bloomberg consensus for Core PCE inflation is 1.8%, the same as March’s figure.
So, the economy is definitely heating up. Whether it’s now comparable to the 1960’s and 1970’s seems doubtful to me.
Disclosure: None.


