
Nowcasts, Economic Indicators, Expectations
On the eve of the advance GDP release for Q1.
Nowcasts:

Figure 1: GDP in bn. Ch.2012$ SAAR (black), Atlanta Fed 4/28 GDPNow (red), NY Fed 4/23 nowcast (blue), IHS Markit nee Macroeconomic Advisers 4/28 nowcast (green), potential GDP (gray). Source: BEA 2020Q4 3rd release, Atlanta Fed, NY Fed, IHS Markit, CBO (February 2021), author’s calculations.
Forecasts from WSJ April survey:
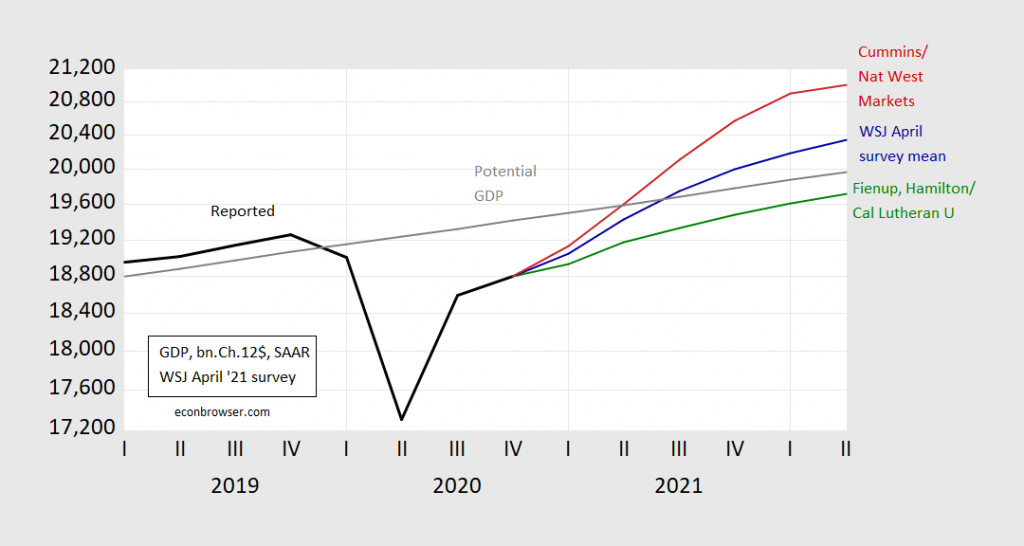
Figure 2: GDP actual (bold black), WSJ April survey mean (blue), Cummins/Nat West Markets (red), Fienup, Hamilton/California Lutheran University (green), CBO estimate of potential GDP (gray), all in billions Ch.2012$, on log scale. Foreacasted levels calculated by cumulating growth rates to latest GDP level reported. Source: BEA (2020Q4 3rd release), WSJ surveys (various), CBO (February 2021), and author’s calculations.
Some higher frequency indicators, tracked by the NBER BCDC:
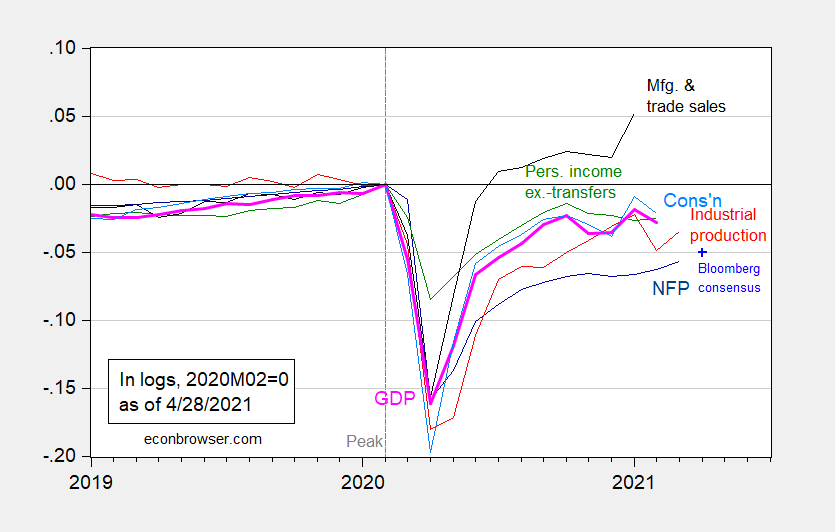
Figure 3: Nonfarm payroll employment from March release (dark blue), Bloomberg consensus as of 4/28 for April nonfarm payroll employment (light blue +), industrial production (red), personal income excluding transfers in Ch.2012$ (green), manufacturing and trade sales in Ch.2012$ (black), consumption in Ch.2012$ (light blue), and monthly GDP in Ch.2012$ (pink), all log normalized to 2020M02=0. Source: BLS, Federal Reserve, BEA, via FRED, IHS Markit (nee Macroeconomic Advisers) (4/1/2021 release), NBER, and author’s calculations.
At the same time, long-term inflation expectations remain anchored, at least by market-based measures.
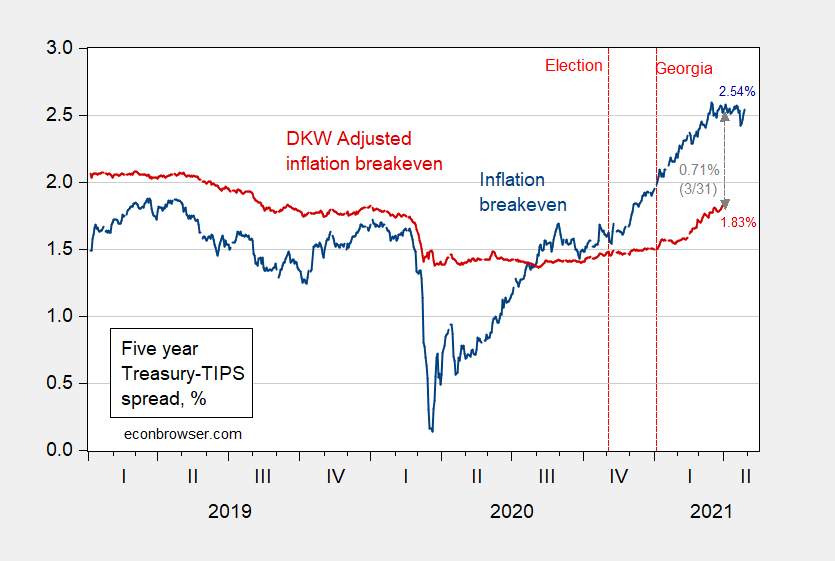
Figure 4. Five year inflation breakeven calculated as five year Treasury yield minus five year TIPS yield (blue), five year breakeven adjusted by term premium and liquidity premium per DKW, all in %. Source: FRB via FRED, KWW following D’amico, Kim and Wei (DKW) accessed 4/28, and author’s calculations.
Hence, expected inflation over the next 12 months (for CPI) remains fairly low (keeping in mind household measures like Michigan and NY Fed are biased upward relative to actual outcomes):
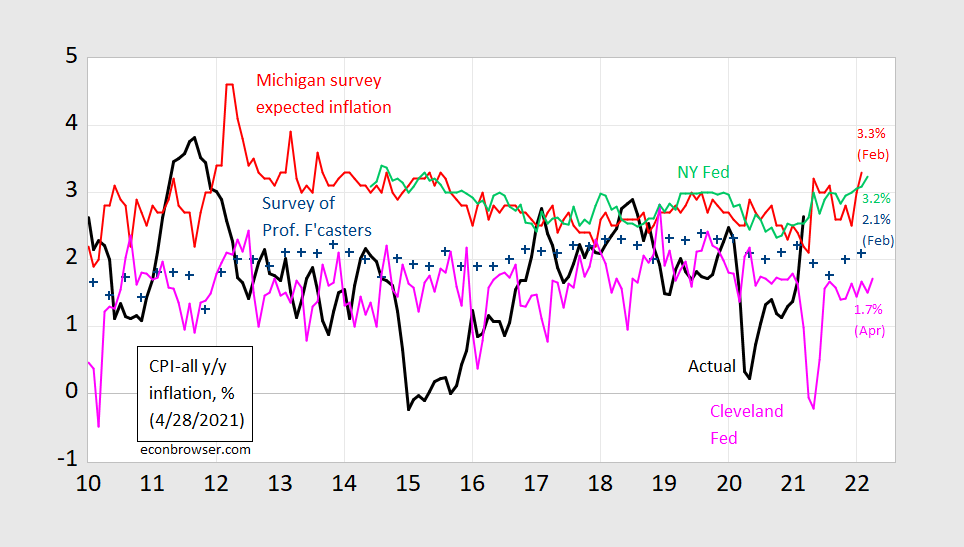
Figure 5. CPI inflation year-on-year (black), median expected from Survey of Professional Forecasters (blue +), median expected from Michigan Survey of Consumers (red), median from NY Fed Survey of Consumer Expectations (light green), forecast from Cleveland Fed (pink). Source: BLS, University of Michigan via FRED, Philadelphia Fed Survey of Professional Forecasters, Philadelphia Fed, NY Fed, and Cleveland Fed.
Look for Jim’s post on the GDP release tomorrow!
Disclosure: None.


