
Nonfarm Payroll Employment Vs. Trend, Pre-COVID-19
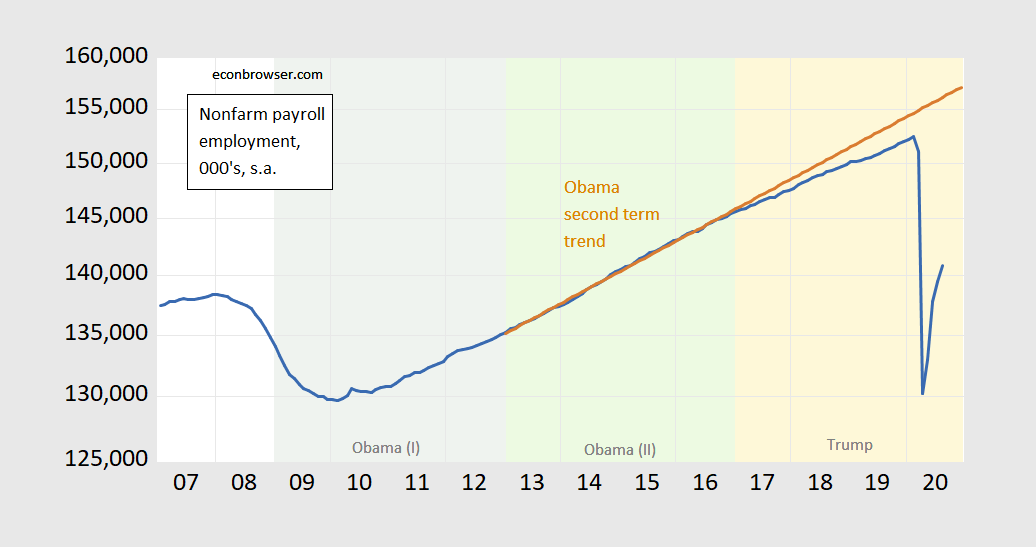
Figure 1: Nonfarm payroll employment (blue), deterministic trend estimated 2013M01-2017M01 (brown), both on log scale. Source: BLS and author’s calculations.
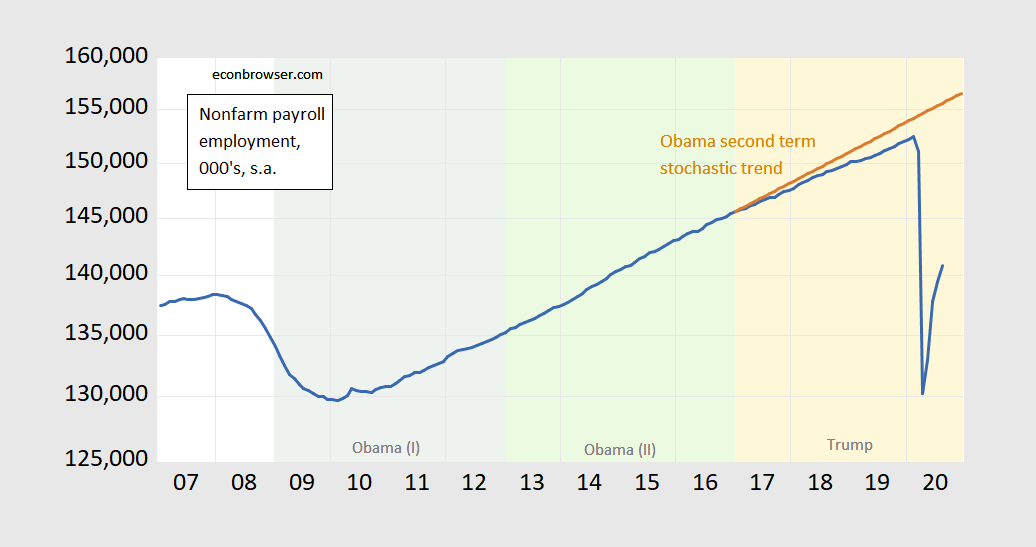
Figure 2: Nonfarm payroll employment (blue), stochastic trend estimated 2013M01-2017M01 (brown), both on log scale. Source: BLS and author’s calculations.
The above graphs are useful if you thought everything was hunky-dory employment-wise, even before the pandemic hit.
Disclosure: None.
How did you like this article? Let us know so we can better customize your reading experience.

Comments
Leave a comment to automatically be entered into
our contest to win a free Echo Show.

