
Top Lessons, Market Movers, And Questions For The Coming Week
How bullish and bearish forces align for stock indexes, forex and other global markets, both technical and fundamental outlooks, likely top market movers. EU really saved?
Summary
–Technical Outlook: Upward Momentum Intact – But Beware Growing Signs Of Indecision
–Fundamental Outlook: Primary data trends, market drivers- what’s changed, what hasn’t, what actually might, and what matters
–New declarations that the EU has been saved – and why they’re wrong, and other top lessons, likely market drivers, and questions for the coming week and beyond
The following is a partial summary of the conclusions from the fxempire.com weekly analysts’ meeting in which we cover the key lessons, drivers, and questions for the coming week.
Lessons
Technical Picture
We look at the technical picture first for a number of reasons, including:
Chart Don’t Lie: Dramatic headlines and dominant news themes don’t necessarily move markets. Price action is critical for understanding what events and developments are, and are not, actually driving markets. There’s nothing like flat or trendless price action to tell you to discount seemingly dramatic headlines – or to get you thinking about why a given risk is not being priced in.
Support, resistance, and momentum indicators also move markets, especially in the absence of surprises from top tier news and economic reports.
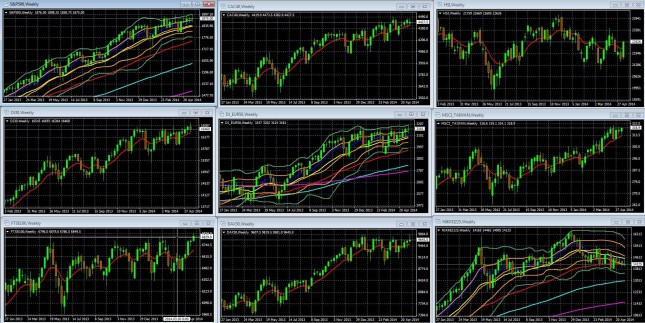
Overall Risk Appetite Medium Term Per Weekly Charts Of Leading Global Stock Indexes
Top Lessons, Market Movers, And Questions For The Coming Week
Weekly Charts Of Large Cap Global Indexes January 27 2013 To Present With 10 Week/200 Day EMA In Red: LEFT COLUMN TOP TO BOTTOM: S&P 500, DJ 30, FTSE 100, MIDDLE: CAC 40, DJ EUR 50, DAX 30, RIGHT: HANG SENG, MSCI TAIWAN, NIKKEI 225
Key For S&P 500, DJ EUR 50, Nikkei 225 Weekly Chart: 10 Week EMA Dark Blue, 20 WEEK EMA Yellow, 50 WEEK EMA Red, 100 WEEK EMA Light Blue, 200 WEEK EMA Violet, DOUBLE BOLLINGER BANDS: Normal 2 Standard Deviations Green, 1 Standard Deviation Orange.
Source: MetaQuotes Software Corp, www.fxempire.com, www.thesensibleguidetoforex.com
01 May. 18 09.46
Key Points: Upward Momentum Intact – But Beware Growing Signs Of Indecision
- US and European indexes continue to move gradually higher or hold steady near their multi-year or all-time highs. Medium term upward momentum remains intact as the indexes continue to close in their Double Bollinger Band buy zones.
- Flat trading ranges of past months taking their toll, weakening momentum.
- Ultra tight trading ranges: Most of our sample US and European indexes remain stuck in very tight trading ranges. For example, The S&P 500 has closed virtually unchanged over the past 2 weeks and within a 15 point range for the past 4 weeks.
- All those dojis: The most outstanding point to note about Western indexes is the unusual number of doji shape weekly candles we’re seeing over the past months. The doji candle is almost all wick with little or no body, meaning that despite a relatively wide trading range there was almost no net change in price over the week. Dojis reflect indecision.
- Except for the UK’s FTSE 100, every US and European index in our sample has flashed at least two doji type weekly candles in the past 4 weeks.
- Nowhere is this tendency better illustrated than on the largest cap index of all, the S&P 500 shown below, which has printed 3 in the past 4 weeks, 7-9 out of the past 16 weeks (depending on how strictly you define dojis).
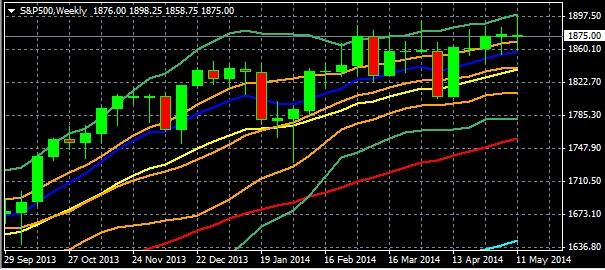
S&P weekly chart September 29 2013 To Present
Key: 10 Week EMA Dark Blue, 20 WEEK EMA Yellow, 50 WEEK EMA Red, 100 WEEK EMA Light Blue, 200 WEEK EMA Violet, DOUBLE BOLLINGER BANDS: Normal 2 Standard Deviations Green, 1 Standard Deviation Orange.
Source: MetaQuotes Software Corp, www.fxempire.com, www.thesensibleguidetoforex.com
03 May. 18 11.07
By themselves dojis may not mean much, and in general Japanese candle patterns by themselves are not adequate evidence of trend reversals. Here’s why we think they’re worth noting for the coming week:
When they appear at the top or bottom of a long-lived trend, they take on added significance and suggest that investors may lack the confidence to push the trend higher (or lower).
Moreover, we’ve seen so many top economists, analysts, and fund managers openly worried that stocks are too expensive, so the unusual frequency of dojis is worth noting.
Beware the doji pair: Over the past months these dojis have not foretold any material pullbacks, except when we had two in a row, from the weeks of March 23rd and 30th on the S&P 500. The following week of April 6th saw one of the largest drops of the year. Last week we completed another pair.
The weekly charts of our sample Asian indexes show no overall trend for us to draw any general conclusions about the technical outlook for Asia.
Daily Charts: Short Term Neutral
As those tight trading ranges and weekly doji candles indicate, the index daily charts show trendless, neutral momentum, as markets await the next big fundamental driver of risk appetite.
Fundamental Picture
Economic Data Trends Unchanged
Here’s the short version to save you the time of perusing results from prior weeks’ economic calendars.
- US data mixed but overall positive, slow but steady recovery theme continues. Less prominent data points that don’t show up in the major online economic calendars, like US rail traffic and the NFIB’s Index of Small Business Optimism also continue to improve.
- Europe ex-Germany is mostly stagnant-to-recessionary. Germany is growing but feeling the pain of a strong Euro and below-target inflation, hence its more cooperative attitude towards ECB easing
- Japan’s stimulus-fed recovery continues, as it posted annualized GDP growth of 5.9% in Q1 2014, its best result since 2011. Some of that growth may be due to spending that was pushed forward ahead of the 3% sales tax increase that hit in April. Consumer spending enjoyed a 2.1% increase over Q4 2013, representing the best performance since Q1 1997. Capital expenditure rose 4.9%, their best levels since 2011, rising by 4.9% – the best performance since an 8.2% rise in the aftermath of the 2011 natural disaster.
- That’s a big deal because like the US, domestic consumption accounts for about 60% of GDP.
- The big question is whether or not the economy will continue to expand despite the added burden of the 3% sales tax increase.
- China’s economy continues slow, while the frequency of its conflicts with its neighbors continues to rise. Is there a connection? The situation is similar to that of Russia and the West in that if everyone acts according to their economic interests, then neither conflict is likely to interfere with ongoing trade. As long as no one’s national honor is unacceptably violated (always a risk) these conflicts generate headlines but little sustained economic impact. Longer term, look for everyone to reduce their economic vulnerabilities to trade sanctions from their opponents.
Neighborhood Bullies
For example, next week Russia is due to finalize a deal to supply energy to China, reducing its dependence on the European customers.
Primary Market Drivers Unchanged
The same drivers of the overall uptrend in global and other risk assets remain in place.
Low rates: Most of the largest central banks (ECB, PBoC, BoJ) remain in easing mode, as growth and labor markets need to improve in these economies, and inflationary pressures are absent. The Fed has stopped easing but, as we noted here, markets don’t see an actual rate hike until late 2015, later than current Fed guidance. See here for further details. Those seeking returns on cash that have a decent chance to outpace longer term inflation are stuck with the same risk assets that have been trending higher for the past few years.
No risk-off drivers: The EU crisis remains in hibernation for now (more on that below) and geopolitical tensions from Russian and Chinese aggression are not expected to affect business as usual. For example, France has given no sign that it won’t complete its €1.2bln sale of warships to Russia.
Sure, there are threats to these, and those threats are a normal part of sustainable bull markets because they maintain enough caution to prevent a sudden exhaustion of buyers to fuel further gains.
FT.com: EU And Euro Have Been Saved – The Big Lessons, Stated And Unstated
The financial times had a great series of articles entitled “How The Euro Was Saved.” It was fascinating account not only of what was done, but of the decision making process, or lack thereof, and world leaders deal with global crises. Unless more parts are added, here are the key lessons I learned both from what the articles said, and what they didn’t.
The promised terms of the EU’s rescue that were key to calming markets, haven’t happened yet, and don’t appear to be coming any time soon.
As stated in Part 3, the EU and EUR were saved by German willingness to
- Financially back a fund that would be large enough to calm credit markets and keep borrowing costs of shaky EU banks from rising to the point of forcing these banks, and their national governments, into default
- Support ECB President Draghi’s claim to “do whatever it takes” by agreeing to his Outright Monetary Transactions (OMT) plan (buying sovereign bonds to restore confidence in them and to lower their yields), but on the condition that shared burdens came with centralized control and oversight of EU banks.
The key passage in Part 3 states:
In December Ms Merkel won agreement for a “fiscal compact” requiring all eurozone countries to write the EU’s tough budget rules into national constitutions…she struck a deal that would mark the biggest shift in sovereignty since the euro’s creation: in exchange for allowing common eurozone funds to rescue failing European banks, oversight and liquidation of those institutions would move from national to EU control
Thus markets began calming after Draghi’s July 26 2012 speech promising the ECB would do “whatever it takes,” on the belief that the EU would have a system to guarantee the solvency of EU member states, and centralized fiscal and banking oversight to prevent future crises.
The slight problem is that neither of these twin pillars of EU salvation has quite become reality.
- First, as we’ve written about repeatedly, the big EZ bank rescue fund won’t exist in any meaningful amounts for years, and even if it was fully funded yesterday it would be too small
- Second, it does not move oversight and control over failing banks to the EU, but largely leaves real power with the sovereigns, and requires too many approvals from too many decision making bodies to deploy fast enough to avoid risk of market panics.
See (here and here) for details.
Another problem, the “whatever it takes” was the OMT plan, another key ingredient in calming markets about EU banks’ credit worthiness and receding contagion risk.
However, Germany’s backing for the OMT plan was conditional on “conditionality,” no OMT bond buying unless the country agreed to terms geared to insuring honest accounting and oversight of the troubled bank, and a reasonable chance that the bank would actually repay the bonds the ECB purchased.
That was too much to ask of Spain, which never accepted the OMT aid because it viewed the German conditions as unacceptable, and instead got the aid by threatening to drag the entire EU down with it.
So the OMT plan has never actually been tried, never mind proven. Indeed, Spain’s refusal to use it and still get aid suggests that it doesn’t work.
Meanwhile, there’s no centralized bank rescue fund, no real functioning central EU banking authority, and no proven OMT plan that meets Germany’s terms for support.
The markets were calmed by as yet unfulfilled promises.
In the fourth installment, author Peter Spiegel acknowledges that the while the euro was saved, its permanence isn’t yet secure, for a variety of reasons. These include:
…federal eurozone budget to provide buffers for countries going through temporary economic setbacks, no commonly backed eurozone bonds to level out borrowing costs, no large-scale harmonisation of national economic policies. And countries such as Greece, Ireland, Italy and Portugal remain heavily indebted.
He notes that “reform fatigue” threatens to prevent these needed changes, as does rising anti-Brussels sentiment (as the EU Parliamentary elections approach in few weeks) when what’s needed is more centralization rather less.
In other words, to ensure its survival the EU needs to become more of a United States of Europe, when in fact neither its members’ leaders nor their voters want to cede more sovereignty.
In sum, the EU and Euro have not been rescued yet, Draghi merely succeeded in buying it time to evolve into what it must become to survive, a true economic and political union, as well as currency union. That hasn’t happened yet.
Rising US Inflation Threat?
Core inflation surprised to the upside last week, +0.236% versus an expected+0.1%. This brought the year-on-year core inflation rate to 1.826%, its highest in a year, and probably the lowest it is likely to be in the coming years.
Ironically, just as the Fed has begun to express concern about deflation fears, core inflation is turning higher. Note that core inflation never got below 1.6% – very far from “deflation” – and even that was only because of well-known effects from the sequester last year on Medicare payments. Median inflation, which eliminates the influence of small outlier decreases (and increases) on core inflation, is now at 2.2%. It has not been higher than that since mid-2012. Median inflation hasn’t been higher than 2.3% since 2009, so actually inflation is much closer to the highs of the last five years than to the lows.
A review of the subcomponents doesn’t alter this picture. Of the eight major subcomponents, six (Food & Beverages, Apparel, Transportation, Medical Care, Recreation, and Education & Communication) accelerated over the past year, while only two (Housing and “Other”) slowed.
If we get a sustained move over the Fed’s 2% target, then that could be enough raise speculation about a faster than expected tightening schedule, which would boost the USD. For more details, see here.
A Relatively Bearish Sign Of The Bullish Times: David Tepper Says He’s Nervous
Remember, he was one of the most famous ‘don’t fight the Fed’ fund managers to go long when QE started and while others were too nervous to be bullish. Oh, he was also reputedly paid $3.5 bln in 2013, making him the highest paid hedge fund manager. So when founder of Appaloosa Management David Tepper talks, people listen, and when he says he’s nervous, they really listen. This past week at SkyBridge Capital’s SALT conference in Vegas he reiterated (and thus reinforced) a growing nervousness among stock investors:
“I’m not saying go short, I’m just saying don’t be too fricking long right now… There’s (sic) times to make money and there’s times not to lose money. This is probably (a time when) you’re supposed to think about preserving some of your money … I think it’s nervous time.
His reasons included the already widespread concerns about slow or slowing growth in the US and Europe (we’d add China, Japan, and most other major economies) as well as the ECB’s failure to act sooner against deflation.
Right or wrong, his comments were quoted all over the financial media on Wednesday. Given the lack of meaningful news that day, they may have been as much a reason as any for US and EU stocks to finish slightly lower.
That said, he remains 60% long stocks, compared to his earlier 100% allocation, so if he’s a sign of the times, then the times remain bullish, just more ambivalently so.
The Lesson Of The Rally In US Bonds
Stocks remain near all-time highs, so we don’t think bond demand is coming on a major flight to safety move.
Instead, as Bill Gross suggests here, and as we discussed in our EURUSD outlook here, markets remain convinced that US rates aren’t moving anytime soon.
“Eurocrats” Continue To Discourage Investment
The EU is already known as a regulatory minefield for foreign firms at time when it needs their investment more than ever.
French Prime Minister Manuel Valls signed a decree allowing France to block foreign takeovers of French firms in the energy, water, transport, telecoms and health sectors. The move risks deterring foreign investors from doing business in France at a time that it’s economy is stagnating. The immediate motive is to give France more say in the potential sale of Alstom’s (ALSMY) energy assets to GE (GE) or Siemens (SI).
Google has reportedly received requests from multiple EU sources, including from a politician seeking to suppress links to articles about him, to exclude links from its search results.
After a landmark European verdict on Tuesday that search engine companies can be asked not to display information that is deemed (by who?) old or irrelevant. This raises fears that Google (GOOG, GOOGL) and Yahoo (YHOO) will be deluged with requests. Both firms are trying to figure out how they’re going to implement the seemingly vague ruling.
This Week’s Likely Top Market Movers
There aren’t so many sources of really market moving events this week.
Sources of Surprise
Beyond the scheduled economic calendar described below, the likely sources of market moving events are rising geopolitical tensions that threaten to actually affect the global economy. These include:
Coming EU parliamentary elections: Parties that favor member nations retaining control over their banks and economies are expected to be the big winners, even though few disagree that the EU needs to move to greater political and economic integration to survive. Watch for articles on the perils, or lack thereof, posed by this shift in the EU parliament’s balance of power.
“Neighborhood Bully” Troubles
- Coming Ukraine elections and related tensions: Ukraine elections due May 25th. Their assumed pro-Western slant is supposedly what got Putin set on limiting or reversing that development.
- China Versus Assorted Smaller Neighbors: This gets markets nervous only if China looks ready to go military with someone with whom the US might have to defend. Unlikely, but bears watching.
Top Calendar Events To Watch
The release of US FOMC minutes on Wednesday, and European flash PMIs Thursday are the events most likely to have a direct influence on the pair in a typically light late in the month week calendar. Beyond these, there are seven different Fed Presidents speaking, including Janet Yellen. However her speech is only a prepared commencement speech at NYU without any follow up questions from the audience, so it’s likely to be the least potentially revealing of them all.
Monday: Nothing
Tuesday: German PPI: If lower than expected, it could fuel ECB easing expectations as it might increase German support for easing measures aimed at eliminating the deflation threat.
Wednesday
US: Fed Chair Yellen speaks, and FOMC meeting minutes released. This is our big chance for the week to get an update on Fed policy thoughts.
Thursday
China: HSBC flash manufacturing PMI. This is important for the pair insofar as it influences overall risk appetite, which the EURUSD generally tracks fairly closely (except in times of sudden ECB or Fed policy shifts, real or suspected).
EU: Flash German, French, and EU manufacturing and services PMIs. After last week’s depressing GDP figures, these give us our latest update on the state of the EU economy, and an overall upside surprise could help restore hope for the EU and help undo some of last week’s pullback.
US: Weekly new jobless claims (better see the four week moving average here), flash manufacturing PMI, existing home sales.
Friday
EU: German Ifo business sentiment survey
US: New home sales.
Biggest Questions & What To Watch To Answer Them
The biggest ones include:
- The extent and scope of coming and future ECB easing
- Whether the Ukraine crisis spurs a new round of risk aversion. There are other potential sources of risk off trade, like tensions with China or EU crisis issues, but thus far these do not appear to be imminent threats. That said, an escalation of tensions with Russia is the most likely source of trouble, particularly as the situation develops in Eastern Ukraine, and Ukraine’s May 25 elections approach.
The above is for informational purposes only, responsibility for all trading or investing decisions lies solely with the reader.


