
“Has Buffett Lost His Touch?” – Here We Go Again
Shares of Kraft Heinz (KHC) are down nearly 30% today following a big earnings miss and the disclosure that the company has been subpoenaed by the SEC. KHC accounts for more than 7% of Berkshire Hathaway’s’ equity portfolio, and that stock is trading down close to 2% ahead of this weekend’s earnings report on a day when the broader market is firmly in positive territory. Following this weekend’s report, Warren Buffett himself will be all over financial television on Monday to talk about all things Berkshire and its portfolio of companies
Given the confluence of events, though, the question of whether or not Buffett has lost his touch is once again making the rounds. Remember, it was just a week ago that Coca-Cola (KO), which accounts for over 10% of the Berkshire equity portfolio, dropped over 8% after it reported earnings. In the case of KO, last Thursday’s decline was the most negative reaction to earnings the stock has had since 2002! With two stocks comprising 18% of Berkshire’s total equity portfolio getting demolished on earnings, you can’t blame traders for being a little more skeptical and taking some profits in their Berkshire positions. Year to date, the stock is one of less than 35 stocks in the S&P 500 that are actually in the red YTD.
(Click on image to enlarge)
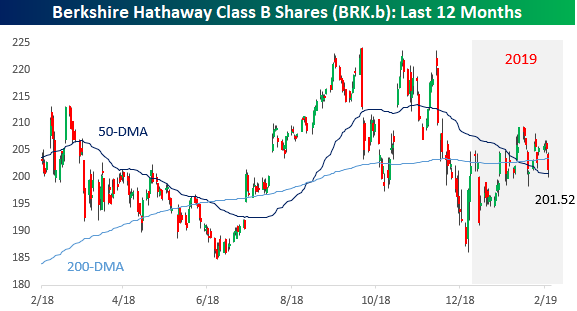
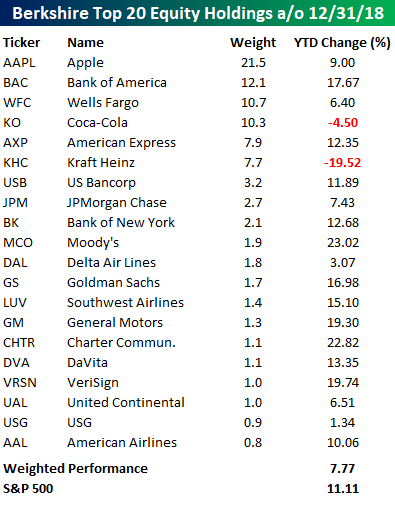
While both KHC and KO have been earnings disasters for Berkshire, the rest of the equity holdings in the portfolio have been performing just fine so far this year. The table below lists the top 20 equity holdings of Berkshire Hathaway as of the end of 2018, and for each stock, we include its weight in the portfolio as well as the YTD change. Of the top 20 holdings, KHC and KO are the only two holdings in the red YTD, while stocks like Moody’s (MCO), Charter (CHTR), Verisign (VRSN), General Motors (GM), and Bank of America (BAC) have all been big winners. Only the top twenty names are listed below, but the weighted average YTD performance of Berkshire’s entire equity portfolio has been a gain of 7.77%. Granted, that’s over three percentage points less than the S&P 500, but it’s hardly a disaster and actually quite impressive when you take into account the big declines in KHC and KO.
(Click on image to enlarge)
Disclaimer: To begin receiving both our technical and fundamental analysis of the natural gas market on a daily basis, and view our various models breaking down weather by natural gas demand ...
more

