
My Chart Says Everything About Bitcoin Prices Right Now
"Eventful" doesn't even come close to covering it when it comes to the week cryptocurrencies like Bitcoin just had…
Over the past five days, Bitcoin has moved lower, from a high of $51,400 last Friday to $43,400 at midday Tuesday. You guessed it – it started with a tweet.
Tesla Inc. (Nasdaq: TSLA) CEO Elon Musk, whose tweets are a huge "mover" of Bitcoin, helped ignite the drop when he said his electric vehicle company would "reconsider" accepting payments in Bitcoin because of its high energy demands and big carbon footprint. That was bad news for Bitcoin, but good news for cryptos the market sees as "green," like Cardano's ADA.

Image Source: Upsplash
Then he teased the possibility that Tesla might unload all or part of its $1.5 billion-plus Bitcoin stash. That wiped around $300 billion off the crypto market before Musk came back on Monday to say that Tesla wasn't selling any Bitcoin.
It's enough to give you whiplash, and if you look at Musk's Twitter account… well, the response hasn't been pretty. I'll let the media unpack all that.
It's tough to know what to make of all this, but the good news is you don't really have to make anything of it.
What I mean is, whether the tweets are bullish or bearish, the business and investment case for owning Bitcoin hasn't really changed; it's still as strong as it's been in years, and I'm still bullish.
We're going to cut through the noise today with the most important Bitcoin chart you'll see all week – it'll show you exactly how to move to bank maximum Bitcoin profits…
Making Sense of Bitcoin's Wild Ride This Month
So, it's clear Elon Musk is easily one of the most outspoken, powerful voices in the crypto world, and his company owns a lot of Bitcoin. Even if what he says or tweets in the real world or on Saturday Night Livedepresses prices at the time, his actions recently and over the long term have been pretty bullish on digital assets.
It feels like a million years ago in the world of crypto, but back in late April, while Tesla's management revealed a record-breaking quarter, it also revealed that, yes, Tesla had sold some of its Bitcoin holdings.
The earnings call reported Tesla had sold around 10% of its Bitcoin holdings at the time, for around $272 million in proceeds and $101 million in profits. A lot of voices on Twitter let Musk have it, but his actions – and then his words – suggest the sale was made to prove that Bitcoin was a liquid, lucrative asset up there with the best of 'em.
But there was one Twitter exchange at the time that stood out to me:
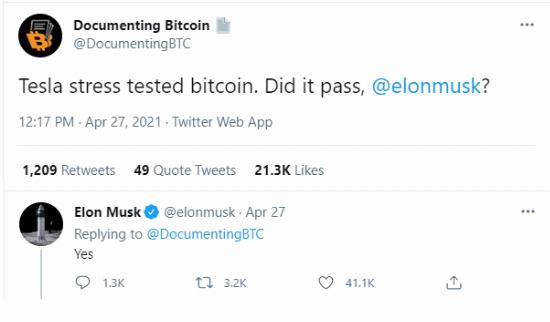
I can't really think of a better way a company like Tesla could prove that. Buy crypto low, sell it higher, book profits – isn't that the way it's supposed to work? Seems that way to me.
So, when Musk or anyone else suggests they're going to sell, it's probably best to take a minute, take it with a grain of salt, and watch for what they actually do. In this most recent tweet, Musk clarified that Tesla was going to "HODL" and hang on to its Bitcoin position, and the digital currency rebounded.
With all that said, let's look at the Bitcoin chart and see what it's telling us.
The Key Bitcoin Levels to Watch and Buy
Let's take a look at a chart screenshot from my weekly YouTube streaming session:
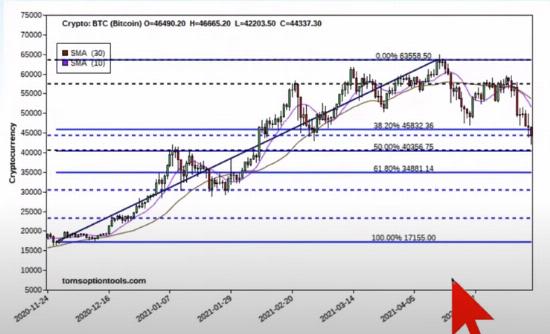
This chart goes all the way back to around Election Day 2020 when Bitcoin was around the $20,000 level; it dipped and then popped back up, and dipped again for a classic "double bottom" at around $17,100 – that's a strong bullish signal, and if you look at the chart, you can see why. It was a critical time for Bitcoin's massive move higher than what's happened ever since.
Now take a look at the solid blue lines running across the chart. Those are key Fibonacci "Fibo" retracement levels based on Bitcoin's high of more than $63,558 back in mid-April and its low of more than $17,155 back in December 2020. You can divide the vertical distance between that low and high by 23.6%, 38.2%, 61.8%, and 78.6% (I also like to use 50%, even though it's not "official") to get the Fibo levels. They still work pretty well if you want to round them to the nearest whole number.
I often use the 38.2% level, the 50%, and the 61.8% in my trading, though that choice is up to you.
If we zoom into my screenshot, you can see where my Bitcoin Fibos are:
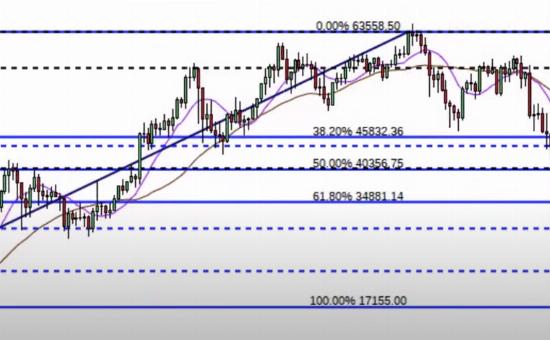
Zooming in, you can see that we get the $45,832 level, $40,356, and the $34,881 level. As I've said before, these make for great support and resistance levels. In other words, the Fibos are like "targets" you can aim for to set your buy prices if you're long-term bullish or sell prices if you're bearish.
We've broken through the $45,832 level – thank you, Mr. Musk! That ship has sailed.
And that means I'm now looking hard at the "unofficial" 50% level, or $40,356. That is where I'd look to buy – and I'd stress "look" there. Just because you have an order in at that level doesn't necessarily mean you'll get filled, though someone will. You'll likely fill a little below that.
So, we may very well see Bitcoin bottom out in the neighborhood of $40,350 before buyers start to come back to their senses and come out of the woodwork.
As I said, this doesn't do much to dampen my enthusiasm for Bitcoin and crypto in general – I'm still bullish, and still forecasting $75,000 by the end of summer – that's around 74% higher from here – and, from there, very likely $100,000 by the end of 2021.
Disclaimer: Any performance results described herein are not based on actual trading of securities but are instead based on a hypothetical trading account which entered and exited the suggested ...
more

