
Doomsday Valuation Makes This Retailer A Buy
This retailer’s stock gained over 20% in one day in early September after the company beat top and bottom-line expectations and reported positive comparable store sales.
This strong quarter reaffirms our belief that The Michaels Companies has been unfairly lumped into the “dying retailers” category, despite evidence to the contrary. The stock is still down 50% from our original Long Idea in June 2018, and the expectations baked into this lowered valuation remain overly pessimistic in the face of the company’s strong fundamentals. Even in a highly conservative scenario, MIK offers significant upside potential. The Michael’s Companies (MIK: $10/share) is this week’s Long Idea.
MIK’s Reported Profits Understate Economic Earnings
MIK’s reported EPS are below its economic earnings per share, which is unusual. Economic earnings are generally lower than reported profits because economic earnings account for more operating expenses, most notably the cost of equity capital.
However, for MIK, we remove several non-recurring expenses that artificially decrease the company’s reported earnings. Most notably, the company incurred $104 million in restructuring charges related to the closing of Aaron Brothers and Pat Catan’s branded stores.
You can find that restructuring charge on the income statement, but you cannot find another $6+ million in non-operating expenses hidden in operating earnings anywhere but the footnotes of MIK’s 2019 10-K. Specifically, we found nearly $1 million in severance costs, $3.1 million in-store closing costs, and $2.9 million related to moving and relocation expenses, franchise taxes, and sign-on bonuses, all of which were found on page 35 of MIK’s 2019 10-K.
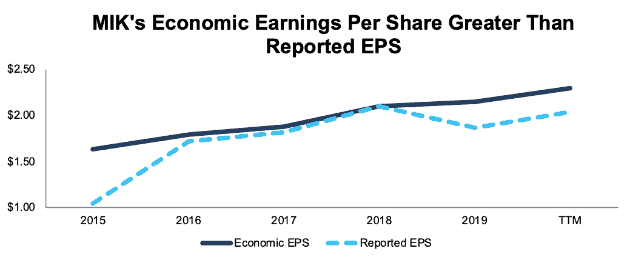
Removing these unusual items explains how MIK’s economic earnings per share increased from $2.10 in 2018 to $2.30 over the trailing twelve month (TTM) period while reported EPS fell from $2.10 to $2.04 over the same period of time. Figure 1 has more details.
Figure 1: MIK’s Economic EPS vs. Reported EPS
(Click on image to enlarge)
Sources: New Constructs, LLC and company filings
MIK Improves the Efficiency of Its Stores
As noted above, store closing costs were one of the factors dragging down Michaels’ reported EPS last year. The fact that Michaels is closing stores might lead some investors to believe business is in decline.
Quite the opposite, Michaels continues to grow, but with a focus on intelligent capital allocation. For example, the company closed all its Aaron Brothers and Pat Catan’s stores last year and four Michael’s stores, but it opened 24 new Michaels stores. Total Michaels stores have grown from 1,182 in 2011 to 1,262 at the end of fiscal 2Q19.
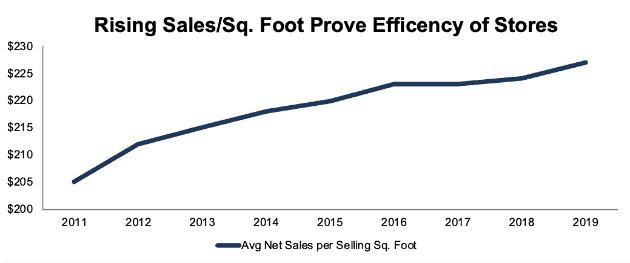
In addition to opening new stores, Michaels continues to increase the efficiency of its existing locations by tweaking product displays, seasonal selection, and other initiatives aimed at driving sales. Since 2011, MIK’s average sales per square foot of core Michaels-branded stores grew from $205/sq. ft to $227/ sq. ft in 2019.
Figure 2: MIK Rising Sales/Sq. Foot Since 2011
(Click on image to enlarge)
Sources: New Constructs, LLC and company filings.
Comparable store sales at Michaels stores have also grown year-over-year in eight of the past nine years. The continued growth in its stores reaffirms our original thesis that The Michael Companies is proving a brick-and-mortar retailer can exist (and grow) in a world where many believe e-commerce will take over.
Margin Advantage Continues
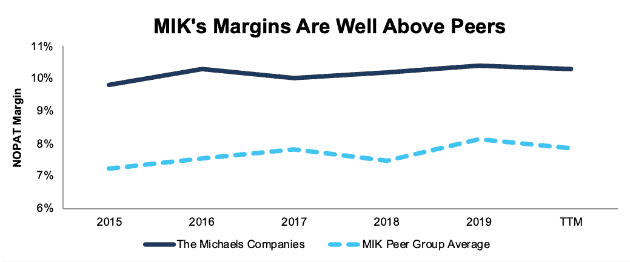
We noted in our original report that The Michaels Companies has a history of maintaining consistently higher NOPAT margins than industry peers, and that trend continues as shown in Figure 3. Michaels TTM NOPAT margin of 10.3% is well above the weighted-average of 7.8% for the 24 other specialty retailers we cover.
Figure 3: MIK Maintains High Margins Relative to Specialty Retail Peers
(Click on image to enlarge)
Sources: New Constructs, LLC and company filings.
E-Commerce Threat is Overhyped
Despite consistent margins, rising sales per sq. foot, and improving economic earnings per share, bears still argue that Michaels cannot withstand the threat from e-commerce giants, such as Amazon (AMZN). However, this argument overlooks many factors, including the hands-on nature of the craft industry,
Most retail items are easy to compare online, as technical specifications are standardized and features can be listed fairly easily. However, crafting supplies are different. Consider types of fabric for instance – knowing the specific texture or feel can be difficult, if not impossible to determine over the internet. As such, it should come as no surprise that in fiscal 2018, e-commerce represented just 4% of MIK’s sales. This trend is similar across the industry as well, as we noted in our original report.
A 2016 study conducted by the Association for Creative Industries (AFCI) and MartizCX, an industry research provider, analyzed purchase location for 11 types of crafting activities. The study found that just 3-13% of consumers bought their supplies exclusively outside of a physical store. Last year, MartizCX released an update to its study that noted 91% of consumer spending in the “creative industry” occurs at physical stores. The high percentage of sales occurring in physical stores means internet giants, or even smaller internet craft stores, are not taking meaningful market share.
Traditional Big Box Retailers Lack Necessary Specialization
Craft retailers also compete with traditional brick-and-mortar giants, such as Target (TGT) and Walmart (WMT). We believe Michaels holds strong competitive advantages over general retailers due to the breadth and specialization of its product lines, which is better-suited to meet the needs of craft consumers.
At the end of fiscal 2018, each Michaels store offered ~45,000 basic and seasonal stock-keeping units (SKUs). These products were broken into general crafts (48%), home décor and seasonal (24%), custom and ready-made framing (16%) and Papercrafting (12%). For reference, the average Walmart Discount Store contains ~120,000 items and the average Walmart Supercenter contains ~142,000 different items. In other words, to offer the same amount of crafting supplies, Walmart would have to dedicate anywhere from 32%-38% of its entire store to arts & craft supplies.
While Walmart doesn’t specifically break out crafting items in the number of products offered, we think it’s safe to say that crafting supplies will never occupy 30%+ of a store’s square footage because Wal-Mart makes too much money on the items it already sells. Plus, the time and effort required to add 45,000 new SKUs would be too high for Wal-Mart to make adequate margin.
Apart from sheer quantity of products, Michaels also offers brands only available in its stores. This exclusivity helps insulate Michaels from pricing wars on commoditized goods offered at traditional retailers. Since fiscal 2013, Michael’s private brands have grown from 48% of sales to 60% of sales in fiscal 2018. This shift to exclusive brands helps differentiate Michaels from its competition.
MIK Investing in E-Commerce, Should Purchasing Preferences Change
While the majority of craft products are purchased in person, MIK is not ignoring e-commerce. In fiscal 2018, the company increased the number of products available online by 48% over fiscal 2017. It also launched buy online and pickup in store capabilities for all U.S. stores. The firm also began developing processes to fulfill e-commerce orders internally (without the need for third-party fulfillment centers), which is expected to help maintain greater control over e-commerce costs. Despite a small portion (4% in fiscal 2018) of sales generated online, MIK is prepared for any change in consumer buying preferences.
Improving ROIC Correlated with Creating Shareholder Value
Despite the near doubling of the stock price since The Michaels Companies reported fiscal 2Q19 earnings, the stock remains significantly undervalued.
Numerous case studies show that getting ROIC right is an important part of making smart investments. This paper compares our analytics on a mega cap company to other major providers. The Appendix details exactly how we stack up. The technology that enables this research is featured by Harvard Business School.
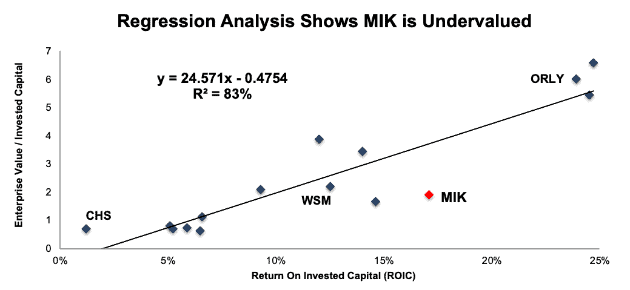
Per Figure 4, ROIC explains 83% of the difference in valuation for the 15 publicly traded specialty retailers Michael’s lists as peers in its proxy statement. MIK trades at a discount to peers as shown by its position below the trend line.
Figure 4: ROIC Explains 83% Of Valuation for MIK’s Peer Group
(Click on image to enlarge)
Sources: New Constructs, LLC and company filings
If the stock were to trade at parity with its peer group, it would be worth $45/share – an impressive 350% upside to the current stock price. Given the firm’s high and consistent profitability, one would think the stock would garner a premium valuation.
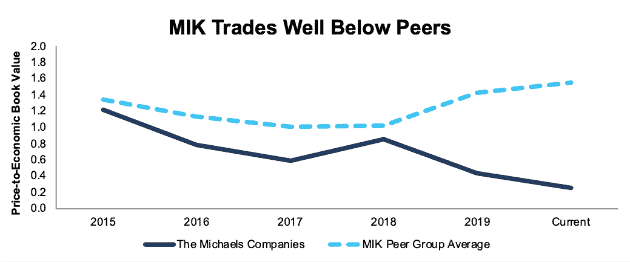
The gap between MIK’s valuation and the valuation of peers from its proxy statement grew significantly in recent years as well. Per Figure 5, MIK traded at a slight discount to its peer group, as measured by the price-to-economic book value (PEBV) ratio, from 2015-2018. This discount ballooned in from 2018 to now, despite no deterioration in MIK’s business operations, as noted above.
Figure 5: MIK Vs. Peers’ Weighted Average PEBV Ratio
(Click on image to enlarge)
Sources: New Constructs, LLC and company filings
Below we’ll use our reverse discounted cash flow (DCF) model to quantify just how pessimistic the current expectations are and how high shares could rise assuming conservative profit growth.
MIK Valuation is Very Pessimistic
As noted above MIK is cheap, and the expectations baked into the stock price are extremely pessimistic.
Figure 6 shows MIK’s price of $10/share implies its NOPAT margins will immediately fall to 8% (equal to the weighted average of peers in Figure 3) and NOPAT will decline 4% compounded annually for the next decade. See the math behind this reverse DCF scenario. Meanwhile, consensus estimates expect MIK’s earnings to grow by less than 1% in 2020 and nearly 4% in 2021.
Figure 6: MIK’s Historical and Implied Future NOPAT Growth
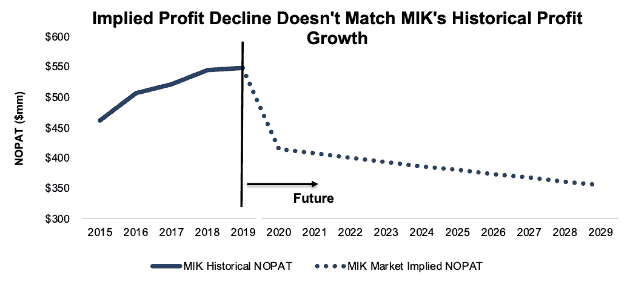
Sources: New Constructs, LLC and company filings
Low Expectations Offer Significant Upside Potential
At its current price of $10/share, MIK has a PEBV ratio of 0.3. This ratio means the market expects MIK’s NOPAT to permanently decline by 70%. This expectation seems rather pessimistic given that MIK has grown NOPAT by 4% compounded annually since 2015.
Such pessimistic expectations offer large upside potential. If we assume that MIK’s NOPAT margins stagnate (at 10%), and it can only grow NOPAT by 1% compounded annually over the next five years, the stock is worth $34/share today – a 240% upside. See the math behind this reverse DCF scenario.
Sustainable Competitive Advantages That Will Drive Shareholder Value Creation
Here’s a summary of why we think the moat around The Michaels Companies business will enable the company to generate profits at a greater level than the current valuation of the stock implies. This list of competitive advantages helps MIK offer better products/services at competitive prices and prevents competition from taking market share.
- Specialized product lineup that offers more variety and choice than competition
- Superior profitability compared to peers
- Efficient store base generating more sales per sq. foot
What Noise Traders Miss with MIK
These days, fewer investors focus on finding quality capital allocators with shareholder-friendly corporate governance. Instead, due to the proliferation of noise traders, the focus tends toward technical trading tends while high-quality fundamental research is overlooked. Here’s a quick summary for noise traders when analyzing MIK:
- Economic earnings per share are greater than, and rising faster than, reported EPS
- Valuation implies a drastic cut to profits that even consensus estimates don’t anticipate
- Michaels is not as vulnerable to e-commerce as many other specialty retail peers
Maintaining Pace with Industry Growth is Enough to Beat Expectations
Given the expectations outlined above, the bar has been set low for MIK to beat earnings and drive shares higher. To do so, the company doesn’t even need to grow faster than projected industry growth rates to surpass expectations.
According to Value Market Research, an industry research provider, the Global Arts and Crafts Market will grow by 5.5% compounded annually through 2024. In our reverse DCF scenario above, we assumed the firm grew profits by just 1% compounded annually, and the stock offers significant upside. Should MIK achieve anything closer to industry growth rates, shares could soar higher.
There are also structural changes to the industry that will help facilitate this growth. The rise of social sites, such as Pinterest and Instagram, along with craft marketplaces such as Etsy makes it easier for people to both learn how to craft, share and monetize the finished result.
The ease of accessing these how-to videos, or sharing your own creations, makes the arts & craft industry more accessible than ever to a wide range of customers. According to a study from the Association for Creative Industries, 41% of consumers in the “Creative Industry” are millennials, 36% are Gen X, and 23% are Baby Boomers. These younger generations are coming of age, achieving greater spending power, and helping drive growth in the arts & crafts industry.
Share Repurchases Could Offer Astounding 22% Yield
The Michaels Companies does not pay a dividend but instead returns capital to shareholders through share repurchases. In fiscal 2017 and fiscal 2018 MIK repurchased ~$250 million and ~$452 million respectively. Through the first six months of fiscal 2019, MIK repurchased $25 million and had $373.4 million remaining under its current repurchase authorization. If the company were to repurchase at the average rate of the last two years, it would repurchase $351 million, or 22% of the current market cap.
Executive Compensation Plan Could be Improved
MIK Executives receive annual bonuses that are tied to a company-wide incentive goal of earnings before interest and taxes (EBIT). Each executive also has individual performance goals, which include cash flow, “improvement of operational excellence”, sales, growth of e-commerce, and more. Long-term equity compensation is granted through options and restricted stock units. The value of these awards are based on market data for comparable roles at peer firms provided by Korn Ferry.
It’s a positive that MIK does not include misleading non-GAAP metrics in its executive compensation plan, but there is still room for improvement.
MIK should tie performance compensation to improvement in ROIC, as there is a strong correlation between improving ROIC and increasing shareholder value[1]. Tying exec comp to ROIC also ensures that executives’ interests are properly aligned with shareholders’ interests.
However, despite using different metrics, MIK’s current plan has not led to executives getting paid while destroying shareholder value. The company has improved economic earnings, the true cash flows of the business, from $331 million in 2015 to $367 million TTM.
Insider Trading is Minimal While Short Interest Shows Pessimistic Expectations
Over the past twelve months, insiders purchased 157 thousand shares and sold 39 thousand shares, for a net effect of 118 thousand shares purchased. These purchases represent less than 1% of shares outstanding.
There are currently 25 million shares sold short, which equates to 16% of shares outstanding and 9.3 days to cover. Short interest has increased 33% over the past year. Continued improvement in The Michaels Companies fundamentals could bring about a short squeeze and send shares higher.
Critical Details Found in Financial Filings by Our Robo-Analyst Technology
As investors focus more on fundamental research, research automation technology is needed to analyze all the critical financial details in financial filings. Below are specifics on the adjustments we make based on Robo-Analyst[2] findings in The Michaels Companies 2019 10-K:
Income Statement: we made $472 million of adjustments, with a net effect of removing $231 million in non-operating expense (4% of revenue). We removed $121 million in non-operating income and $351 million in non-operating expenses. You can see all the adjustments made to MIK’s income statement here.
Balance Sheet: we made $2.0 billion of adjustments to calculate invested capital with a net increase of $1.9 billion. The most notable adjustment was $1.8 billion in operating leases. This adjustment represented 149% of reported net assets. You can see all the adjustments made to MIK’s balance sheet here.
Valuation: we made $4.4 billion of adjustments with a net effect of decreasing shareholder value by $4.4 billion. There were no adjustments that increased shareholder value. Apart from $4.4 billion in total debt, which includes the $1.8 billion in operating leases noted above, the largest adjustment to shareholder value was $10 million in employee stock options. The stock option adjustment represents 1% of MIK’s market cap. See all adjustments to MIK’s valuation here.
Attractive Funds That Hold MIK
The following funds receive our Attractive-or-better rating and allocate significantly to The Michaels Companies.
- Reinhart Mid Cap PMV Fund (RPMVX) – 1.7% allocation and Attractive rating.
[1] This paper compares our analytics on a mega cap company to other major providers. The Appendix details exactly how we stack up.
[2] Harvard Business School features the powerful impact of our research automation technology in the case New Constructs: Disrupting Fundamental Analysis with Robo-Analysts.
Disclosure: New Constructs staff receive no compensation to write about any specific stock, sector, or theme.


