
Don’t Forgo Diligence: This Fund’s Strategy Doesn’t Hold Up
We have shown empirically, that legacy measures of earnings fail to provide investors with reliable measures of corporate performance because they fail to account for unusual gains and losses (hidden and reported). Investors armed with our measure of core earnings benefit from a more informed view of the fundamentals and, therefore, the valuation of markets and stocks.
We leverage this uniquely rigorous diligence on stocks to derive our mutual fund ratings. This diligence provides insights into the fundamentals of the overall fund so investors can determine whether or not a fund allocates sufficiently to quality stocks and can justify its fees. This week, we’ve identified a mutual fund with a methodology that largely fails to find quality stocks and charges above average fees in the process.
Despite its 4-Star Morningstar rating, JPMorgan Mid Cap Growth Fund (OSGIX) is in the Danger Zone.
Backwards Looking Research Overrates this Fund
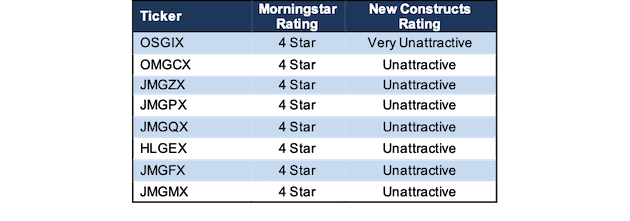
Investors that rely solely on past performance may miss the true risk of investing in this fund. Per Figure 1, OSGIX, OMGCX, JMGZX, JMGPX, JMGQX, HLGEX, JMGFX, and JMGMX earn the 4-Star rating from Morningstar.
Meanwhile, OSGIX earns our Very Unattractive Rating, the worst of our Predictive Risk/Reward Fund ratings, which leverage our superior research[1] featured by Harvard Business School and MIT Sloan. The other share classes of this fund earn our Unattractive rating.
Figure 1: JPMorgan Mid Cap Growth Fund Ratings
Sources: New Constructs, LLC, company, ETF and mutual fund filings, and Morningstar
OSGIX allocates significantly more capital to companies with low profitability and high profit growth expectations baked into their stock prices, which makes its portfolio riskier than the benchmark and the overall market.
Holdings Research Reveals a Low-Quality Portfolio
The only justification for a mutual fund to charge higher fees than its ETF benchmark is “active” management that leads to out-performance. Passive strategies are overcrowded, as we show in The Hidden Dangers of Passive Investing. As a result, active strategies have a unique opportunity to outperform, provided they do more than closet-index or chase momentum. To assess the quality of fund managers’ stock selection, we leverage our Robo-Analyst technology[2] to drill down and analyze the individual stock holdings for 6,900 + funds.
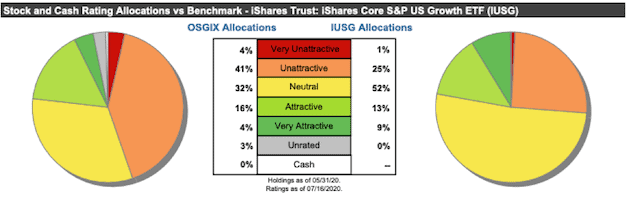
Per Figure 2, JPMorgan Mid Cap Growth Fund’s asset allocation poses greater downside risk and holds less upside potential than its benchmark, the iShares Core S&P U.S. Growth ETF (IUSG).
OSGIX allocates 45% of its portfolio to Unattractive-or-worse rated stocks compared to just 26% for IUSG. On the flip side, OSGIX’s exposure to Attractive-or-better rated stocks is much lower, at 20%, versus IUSG at 22%.
Figure 2: OSGIX Allocates Capital to More Low-Quality Holdings
Sources: New Constructs, LLC and company, ETF and mutual fund filings
Given the unfavorable allocation of Attractive-or-better vs. Unattractive-or-worse rated stocks relative to the benchmark, OSGIX appears poorly positioned to generate the outperformance required to justify its fees.
Active Management Failing to Create Value
In its fact sheet, JPMorgan Mid Cap Growth Fund outlines the main approach to choosing investments for the fund. The criteria include:
- Mid cap companies with above average growth prospects
- Companies with leading competitive positions
- Companies with durable business models
- Management that can achieve sustained growth
Because they’re so broad, these characteristics don’t tell discerning investors much at all about the fund’s investment strategy. Without measurable and accurate profitability and valuation metrics, such as core earnings, return on invested capital (ROIC), and price-to-economic book value (PEBV), investors are buying a black box methodology that, based on Figure 2 above, allocates to low-quality stocks.
Stock Selection Methodology Finds Bad Stocks
Our research shows that OSGIX allocates to stocks with significantly lower ROICs than the benchmark and overall market (S&P 500). Making matters worse, our research finds that OSGIX’s holdings are more expensive, as measured by the expectations for future profit growth reflected in their valuations.
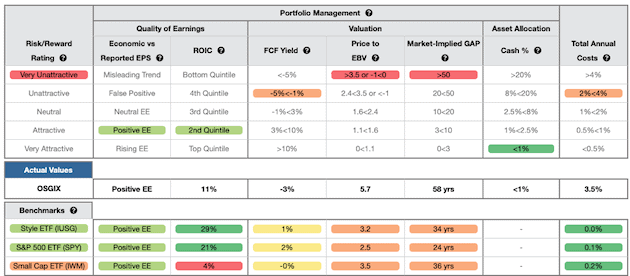
Figure 3 contains our detailed rating for OSGIX, which includes each of the criteria we use to rate all funds under coverage. These criteria are the same for our Stock Rating Methodology because the performance of a fund’s holdings equals the performance of a fund after fees.
Figure 3: JPMorgan Mid Cap Growth Fund Rating Breakdown
Sources: New Constructs, LLC and company, ETF and mutual fund filings
As Figure 3 shows, OSGIX’s holdings are inferior to its benchmark, IUSG, and the S&P 500 (SPY), in four of the five criteria that make up our holdings/Portfolio Management analysis. Specifically:
- OSGIX’s ROIC is 11% and nearly one-third the 29% earned by IUSG and nearly half the 21% earned by SPY.
- OSGIX’s free cash flow yield of -3% is worse than the 1% of IUSG and 2% of SPY.
- The price-to-economic book value (PEBV) ratio for OSGIX is 5.7, which is significantly greater than the 3.2 for IUSG holdings and the 2.5 of SPY holdings.
- Our discounted cash flow analysis reveals an average market implied growth appreciation period (GAP) of 58 years for OSGIX’s holdings compared to 34 years for IUSG and 24 years for SPY.
In other words, the stocks held by OSGIX generate inferior cash flows and have higher valuations compared to IUSG and SPY. The market expectations for stocks held by OSGIX imply profit growth (measured by PEBV ratio) that is well above the profit growth expectations embedded in IUSG’s and SPY’s holdings. Lower historical profits and higher expectations for future profits are a bad combination. Furthermore, in the current market, there is no reason to allocate to overvalued stocks when there are many industry leading firms trading at historical discounts.
Style Drift Is an Additional Red Flag
Prior research has found that fund managers in one style drift into other styles to improve their relative rankings by Morningstar and look more attractive to investors.
Morningstar classifies OSGIX (and other share classes) as a Mid Cap Growth fund. Mid Cap is commonly defined as companies with market capitalizations between $2 billion and $10 billion. However, the weighted-average market cap of OSGIX’s holdings is $23.9 billion, the median is $18.7 billion, and its top 10 holdings have market capitalizations ranging from $16.7 billion to $66.8 billion.
As a result of its holdings, we classify the fund as All Cap Growth. Without holdings analysis, investors in OSGIX think they’re getting exposure to Mid Cap stocks, when in reality the size of firms skews much larger.
Deep Dive on a Bad Stock Holding
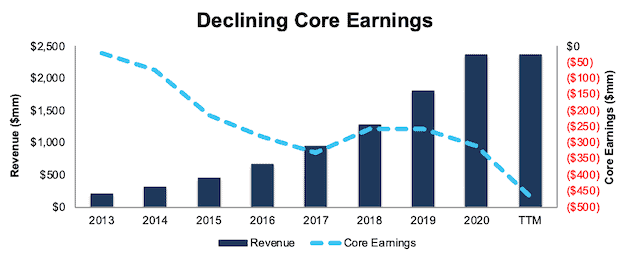
Splunk Inc. (SPLK: $202/share) is one of OSGIX’s holdings that further illustrates how it allocates to stocks with poor fundamentals and overvalued stock prices. Since fiscal 2013, Splunk’s revenue has grown by 42% compounded annually while core earnings have fallen from -$22 million to -$310 million over the same time, per Figure 4. Over the TTM period, core earnings have fallen further to -$469 million.
Figure 4: Splunk’s Revenue & Core Earnings Since 2013
Sources: New Constructs, LLC and company filings
Economic earnings, which not only account for unusual items on the income statement but also changes to the balance sheet, look even worse. Economic earnings have declined from -$23 million in fiscal 2013 to -$562 million TTM. Splunk’s ROIC has also been negative throughout its time as a public company and has fallen from a company-best -10% in fiscal 2019 to -17% TTM.
SPLK is Significantly Overvalued
Despite the deterioration in SPLK’s fundamentals, shares are actually up ~35% year-to-date, ~44% over the past year (S&P +7%), and are significantly overvalued. We use our reverse DCF model to quantify the growth in cash flows SPLK must achieve to justify its valuation.
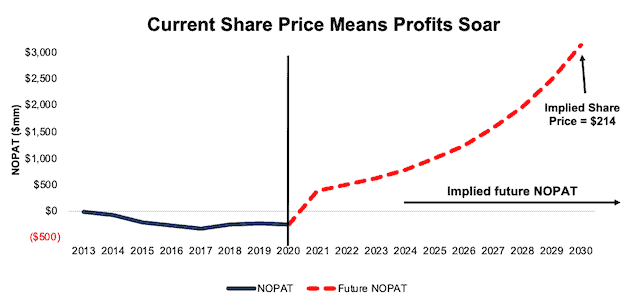
To justify its current price of $202/share, SPLK must immediately achieve a 13% NOPAT margin (average of 64 Software firms under coverage with non-negative margins compared to -17% TTM) and grow revenue by 26% compounded annually for the next 10 years. See the math behind this reverse DCF scenario. In this scenario, SPLK would be generating $23.8 billion in revenue 10 years from now, which today would rank behind only Microsoft (MSFT), Oracle (ORCL), and SAP (SAP) in terms of annual revenue out of the 113 Software firms under coverage.
Figure 5 compares the firm’s implied future NOPAT in this scenario to its historical NOPAT. This scenario implies Splunk’s NOPAT 10 years from now will be nearly $3.1 billion compared to -$393 million TTM. In any scenario worse than this one, SPLK holds significant downside risk, as we’ll show.
Figure 5: Current Valuation Implies Drastic Profit Growth: Scenario 1
Sources: New Constructs, LLC and company filings.
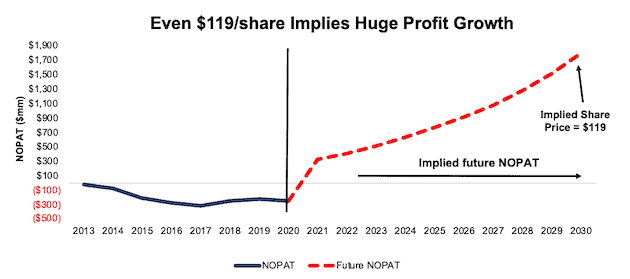
Even if we assume SPLK can achieve a 13% NOPAT margin and grow revenue by 19% compounded annually (including by consensus estimates for the next five years) for the next decade, the stock is worth only $119/share today – a 41% downside to the current stock price. See the math behind this reverse DCF scenario.
Figure 6 compares the firm’s implied future NOPAT in this scenario to its historical NOPAT. This scenario implies Splunk’s NOPAT 10 years from now will be over $1.8 billion, compared to -$393 million TTM.
Figure 6: SPLK Has Significant Downside Risk: Scenario 2
Sources: New Constructs, LLC and company filings.
Each of these scenarios also assumes Splunk is able to grow revenue, NOPAT and FCF without increasing working capital or fixed assets. This assumption is unlikely but allows us to create best-case scenarios that demonstrate how high expectations embedded in the current valuation are. For reference, Splunk’s invested capital grew by an average of $396 million a year (17% of fiscal 2020 revenue) over the past five years.
Excessive Fees Make Outperformance Even More Difficult
At 3.52%, OSGIX’s total annual costs (TAC) are higher than 91% of the 493 All Cap Growth mutual funds under coverage. For comparison, the average TAC of all All Cap Growth mutual funds under coverage is 1.70%, the weighted average is 1.45%, and the benchmark ETF (IUSG) has total annual costs of 0.04%.
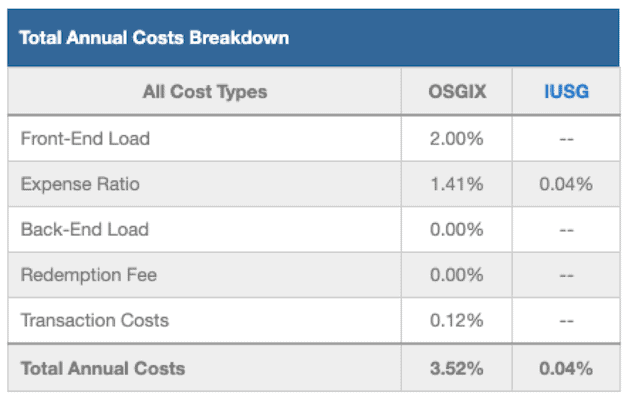
Our TAC metric accounts for more than just expense ratios. We consider the impact of front-end loads, back-end loads, redemption fees, and transaction costs. For example, OSGIX’s front-end load adds 2.00% to its total annual costs and its annual turnover ratio of 54% adds 0.12% to its total annual costs – neither of which are captured by the expense ratio. Figure 7 shows our breakdown of OSGIX’s total annual costs, which is also available for all of the ~6,900 mutual funds under coverage.
Figure 7: JPMorgan Mid Cap Growth Fund Total Annual Costs Breakdown
Sources: New Constructs, LLC and company, ETF and mutual fund filings
To justify its higher fees, each class of the fund must outperform its benchmark by the following amounts over three years:
- OSGIX must outperform by an average of 3.47% annually.
- OMGCX must outperform by an average of 2.03 % annually.
- JMGZX must outperform by an average of 1.73% annually.
- JMGPX must outperform by an average of 1.46% annually.
- JMGQX must outperform by an average of 1.17% annually.
- HLGEX must outperform by an average of 1.10% annually.
- JMGFX must outperform by an average of 0.95% annually.
- JMGMX must outperform by an average of 0.89% annually.
An in-depth analysis of OSGIX and its TAC is available in our standard mutual fund report.
OSGIX’s Performance Can’t Justify Its Fees
When we take into account its load, which adds 2.00% to its total annual costs, we see that OSGIX has failed to outperform and justify its fees.
OSGIX’s load adjusted one-year quarter-end average annual total return underperformed IUSG by over 200 basis points. Its load adjusted five-, and 10-year quarter-end average annual total returns also underperformed IUSG, while its 3-year return outperformed by 1 basis point, none of which is great enough to justify its fees, as noted above.
Given that 45% of assets are allocated to stocks with Unattractive-or-worse ratings, OSGIX looks likely to continue to underperform moving forward.
The Importance of Holdings-Based Fund Analysis
Smart fund (or ETF) investing means analyzing the holdings of each mutual fund. Failure to do so is a failure to perform proper due diligence. Simply buying a mutual fund or ETF based on past performance does not necessarily lead to outperformance. Similarly, blindly diversifying through index funds is no substitute for diligence. Only through holdings-based analysis can one determine if a fund’s methodology leads managers to pick high-quality or low-quality stocks.
However, most investors don’t realize they can access sophisticated fundamental research[3] using data that corrects market inefficiencies and generates alpha. Our Robo-Analyst technology analyzes the holdings of all 520 ETFs and mutual funds in the All Cap Growth style and ~7,600 ETFs and mutual funds under coverage to avoid “the danger within.” This diligence allows us to cut through the noise and identify potentially dangerous funds that traditional backward-looking fund research may overlook, such as OSGIX.
Better-Rated All Cap Growth Funds
The following are some All Cap Growth mutual funds that earn an Attractive rating, have more than $100 million in assets under management, and have below average TAC.
- JPMorgan Intrepid Growth Fund (JGIRX) – 0.69% TAC
- Amana Mutual Funds Growth Fund (AMIGX) – 0.88% TAC
- Glenmede Quantitative U.S. Large Cap Growth Equity Portfolio (GTILX) – 0.90% TAC
- AB Concentrated Growth Fund (WPSIX) – 0.91% TAC
- BNY Mellon U.S. Equity Fund (DPUIX) – 0.94% TAC
[1] Our core earnings are a superior measure of profits, as demonstrated in Core Earnings: New Data & Evidence a paper by professors at Harvard Business School (HBS) & MIT Sloan. The paper empirically shows that our data is superior to “Operating Income After Depreciation” and “Income Before Special Items” from Compustat, owned by S&P Global (SPGI).
[2] Harvard Business School features the powerful impact of our research automation technology in the case study New Constructs: Disrupting Fundamental Analysis with Robo-Analysts.
[3] Compare our analytics on a mega cap company to Bloomberg and Capital IQ’s (SPGI) analytics in the detailed appendix of this paper.
Disclosure: David Trainer, Kyle Guske II, and Matt Shuler receive no compensation to write about any specific stock, style, or theme.


