
Monthly Business Cycle Indicators: The Rebound Continues
With the earlier rebound in industrial production, slightly accelerated growth in consumption, key indicators followed by the NBER BCDC look a little better than even a week ago.
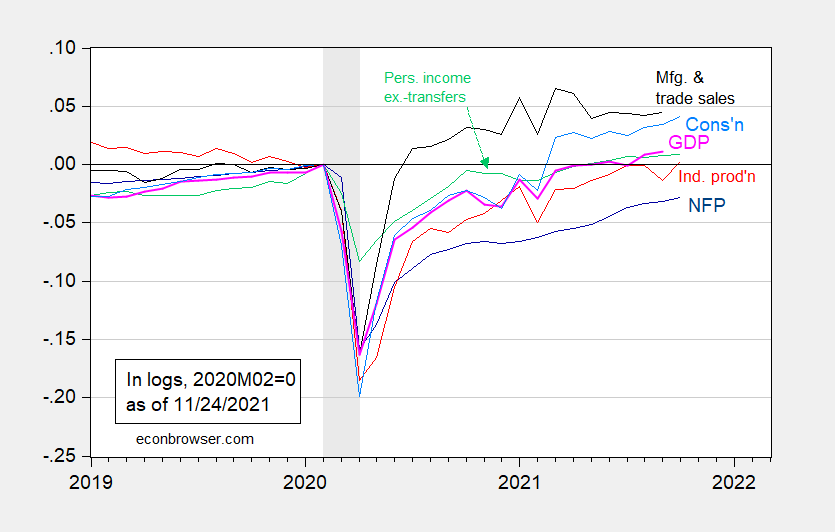
Figure 1: Nonfarm payroll employment (dark blue), industrial production (red), personal income excluding transfers in Ch.2012$ (green), manufacturing and trade sales in Ch.2012$ (black), consumption in Ch.2012$ (light blue), and monthly GDP in Ch.2012$ (pink), all log normalized to 2020M02=0. NBER defined recession dates, peak-to-trough, shaded gray. Source: BLS, Federal Reserve, BEA, via FRED, IHS Markit (nee Macroeconomic Advisers) (11/1/2021 release), NBER, and author’s calculations.
Consumption has not grown this fast (0.7%) since March 2021, when m/m growth was 4.5% (not annualized, in log terms).
IHS MarkIt notes that consumption (along with trade and inventories data) together pushed tracking estimate for Q4 from 4.9% to 6.8% (with other data pushing the tracking estimate to 7.4%). The newly released consumption data alone accounted for 0.3 percentage points of increase (all q/q SAAR).
Disclosure: None.


