
Peeking Into The Future Via Latest CoT Report
Following futures positions of non-commercials are as of September 27, 2022.
10-year note: Currently net short 365.2k, up 135.6k.
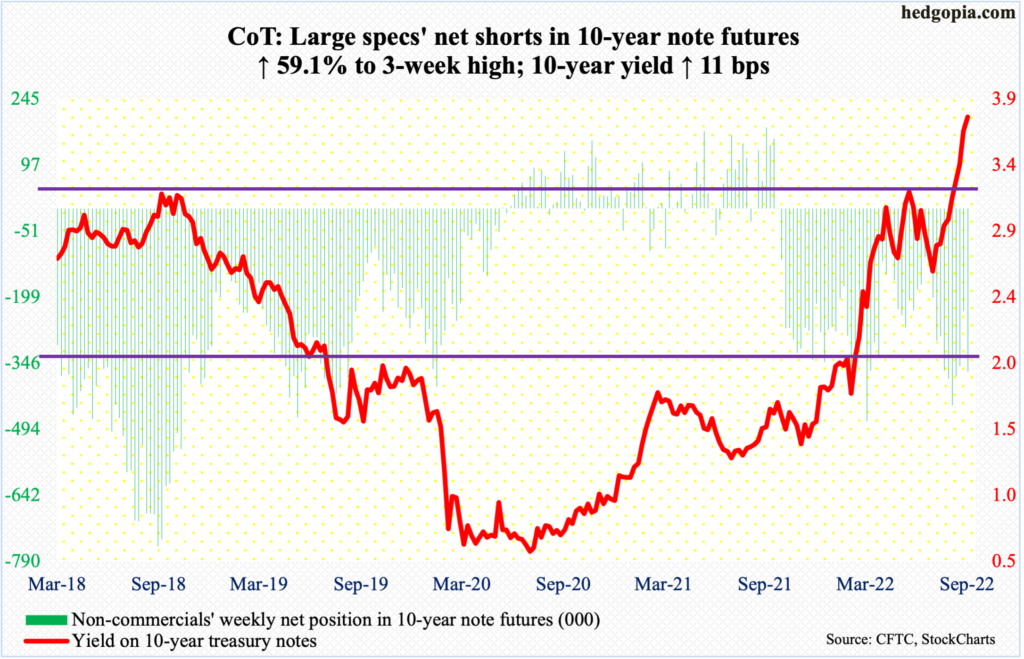
Are we there yet? Makes you wonder considering how the long end of the treasury yield curve has been behaving. The 10-year yield rallied 67 basis points in September, and 11 basis points this week, to 3.8 percent.
Earlier on Tuesday, rates tagged 3.99 percent, which was the highest print since April 2010. Bond bulls (on price, which moves opposite to yields) have been annihilated. Non-commercials, who have been sitting on loads of net shorts in 10-year note futures, have done exceedingly well.
The natural question is, when might these traders start covering?
In terms of yields, the 10-year has rallied for nine weeks in succession. This week ended with a spinning top, which is an indecision candle, so that should give bond bulls (on price) some hope. But it is too early to celebrate. Upside momentum in yields is too strong.
Even if the 10-year has peaked for now and begin to retreat, three percent is where a genuine bull-bear duel is likely to unfold.
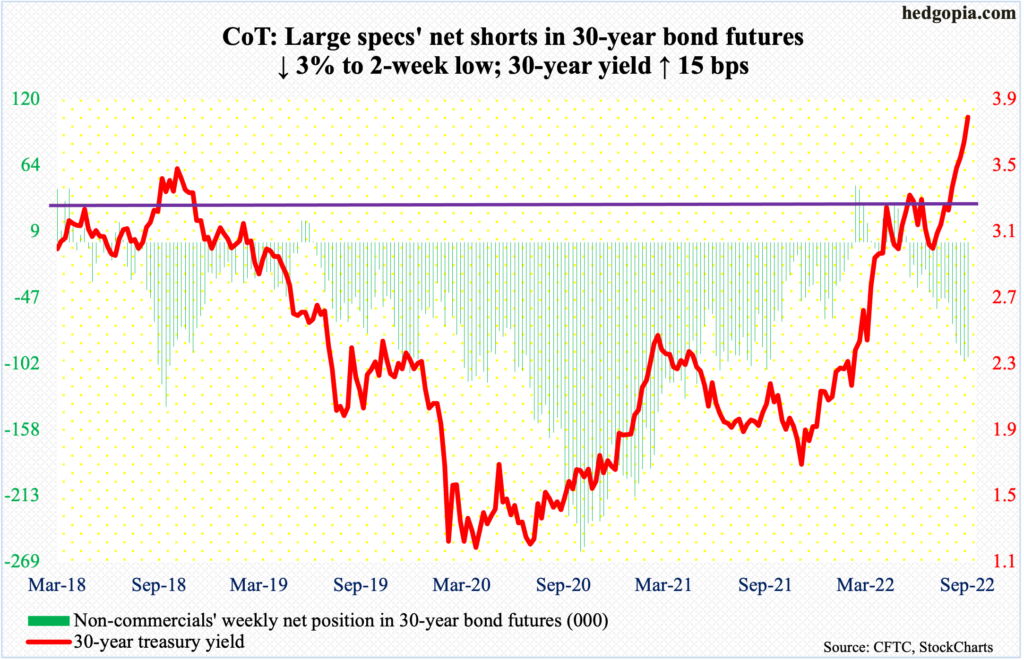
30-year bond: Currently net short 96.6k, down 3k.
Major economic releases for next week are as follows.
The ISM manufacturing index (September) is due out on Monday. In August, US manufacturing was unchanged at 52.8 month-over-month.
JOLTs job openings (August) and factory orders (August) are scheduled for Tuesday.
In July, non-farm job openings rose 199,000 m/m to 11.2 million. The all-time high of 11.9 million was recorded in March.
Preliminarily, August orders for non-defense capital goods ex-aircraft – proxy for business capex plans – increased 1.3 percent m/m to a seasonally adjusted annual rate of $75.6 billion, which was a fresh record.
Wednesday brings the ISM services index (September). Services activity inched up two-tenths of a percentage point m/m in July to 56.9.
Payrolls (September) are on dock for Friday. In the first eight months this year, non-farm payroll increased an average 438,000 – decent but slower than the monthly average last year of 562,000.
WTI crude oil: Currently net long 245.5k, down 5.5k.
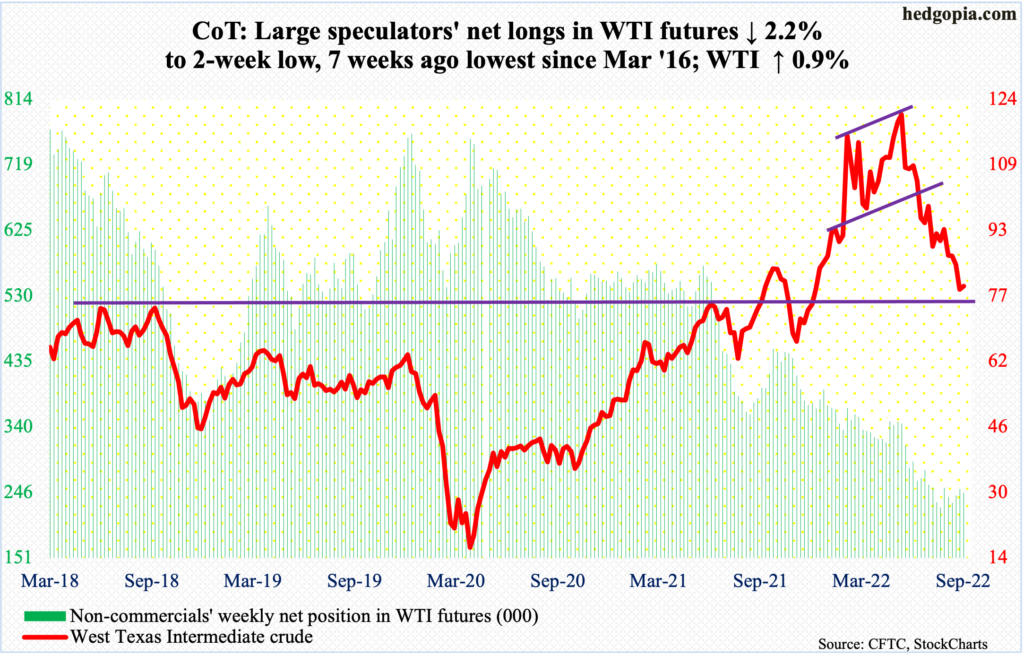
Oil bulls managed to rally WTI ($79.49/barrel) 0.9 percent this week – a spinning top week. This followed four down weeks in a row.
Early in the week, the crude tagged $76.25, just about testing $75, or thereabouts, which has been an important price point going back to April 2006.
Next Wednesday, OPEC+ meet; members are likely to discuss an oil output cut, given the drop in prices. WTI peaked at $123.68 in June and at $130.50 in March before that. A possible output cut helped buoy sentiment.
In the meantime, per the EIA, US crude production in the week to September 23 dropped 100,000 barrels per day to 12 million b/d. Crude imports decreased as well, down 498,000 b/d to 6.4 mb/d. As did stocks of crude, gasoline, and distillates, which respectively fell 215,000 barrels, 2.4 million barrels and 2.9 million barrels to 430.6 million barrels, 212.2 million barrels and 114.4 million barrels. Refinery utilization dropped three percentage points to 90.6 percent.
E-mini S&P 500: Currently net short 150.2k, down 69.2k.
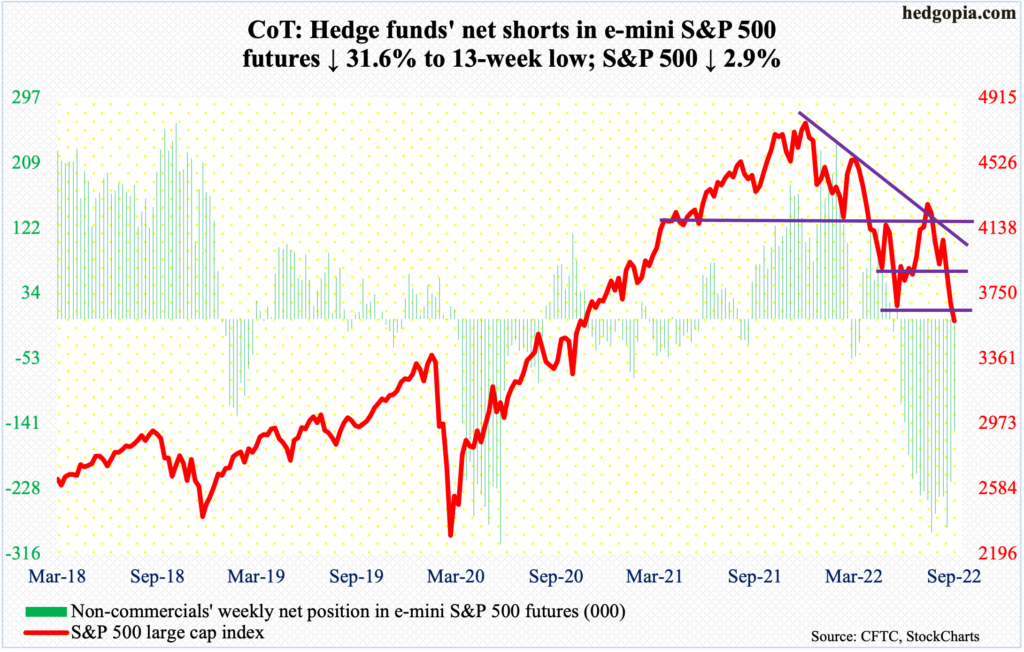
Flows continue to move out of US equity funds. In the week to Wednesday, $11.8 billion was redeemed. This was the sixth consecutive week of outflows, during which a combined $51.5 billion was withdrawn.
After two down weeks and having successfully tested the June lows last week, bulls had an opportunity to salvage the situation this week (more on this here). In fact, they were sitting pretty in the first three sessions, with the S&P up 0.7 percent by Wednesday. Things then did a sharp U-turn in the next two sessions, with Friday slightly breaching the June lows.
Interestingly, non-commercials have been cutting back their holdings of net shorts in e-mini S&P 500 contracts. They probably have been cashing in. From January’s record high through Friday’s low, the large cap index is down 25.6 percent.
Things remain grossly oversold, with sentiment very suppressed (more on this here), but downward momentum is intact. The first step toward damage repair will have taken place once 3630s gets reclaimed. The index ended the week at 3586.
Euro: Currently net long 33.8k, up 348.
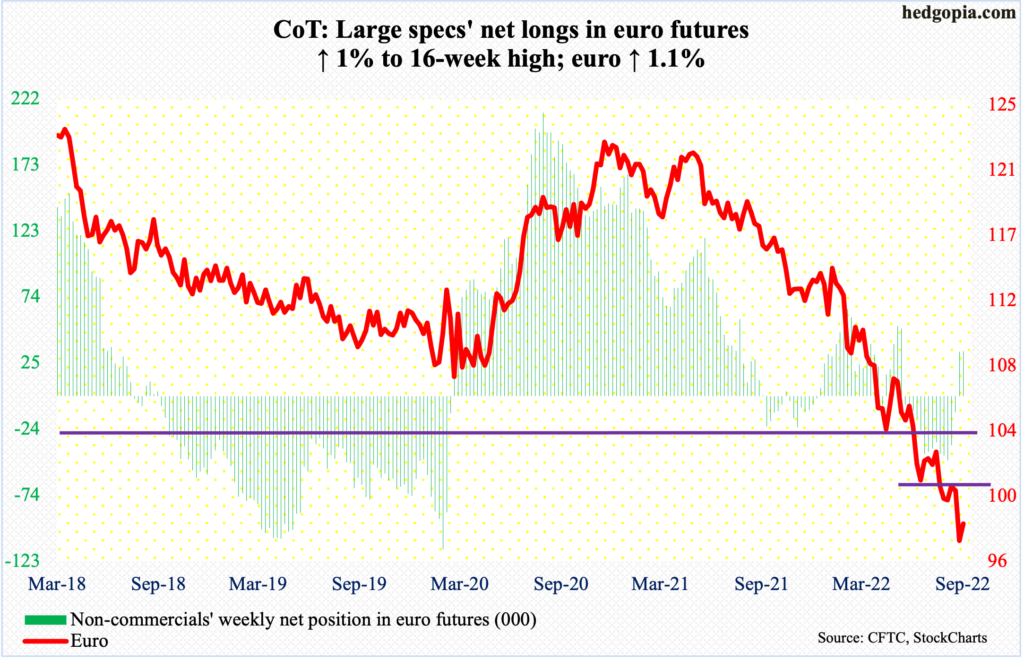
The euro rallied 1.1 percent this week to $0.9801, but not before dropping to $0.9559 intraday Wednesday. In 2000-2002, $0.95 was an important area, with the currency posting a record low $0.82 in October 2000.
It is too soon to say if the downturn that began in January last year when the euro retreated from $1.2345 is over. Bulls will do themselves a favor if they reclaim gap-down resistance at $0.9810s, followed by $0.9910s. Then comes the all-important $1.04, which was lost in July.
Gold: Currently net long 52.1k, down 13.6k.
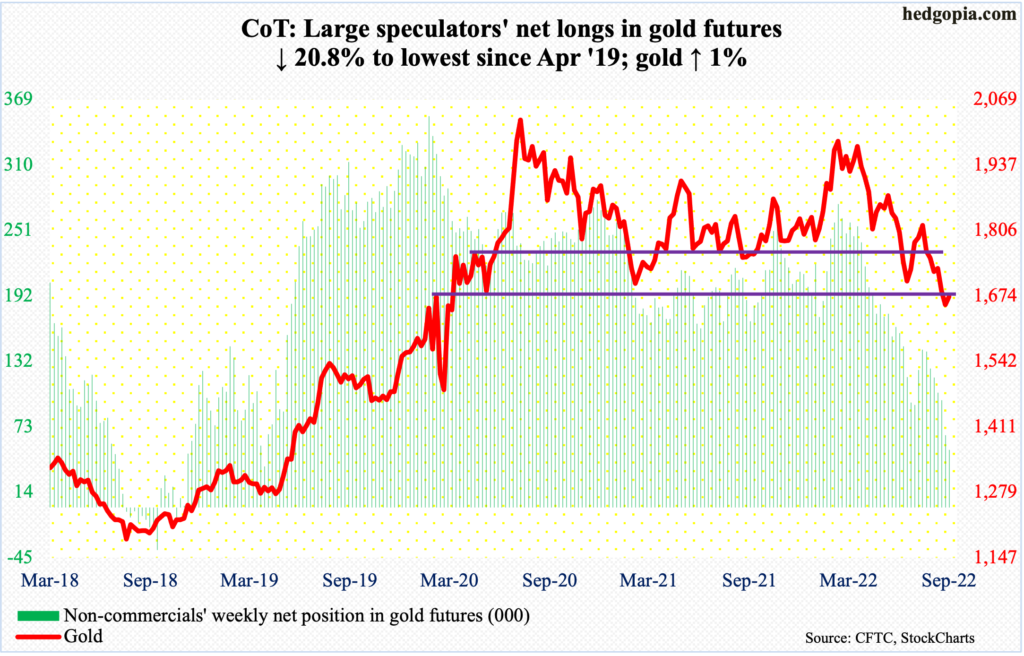
Gold ($1,672/ounce) dropped as low as $1,622 on Wednesday before drawing buying interest. By the end of the week, it was up a percent to land right at horizontal support at $1,660s-$1,670s, which, going back to the early months of 2020, was tested several times, including this July.
This was preceded by a breach of $1,760s-$1,770s toward the end of August.
Inability to decisively reclaim $1,660s-$1,670s may eventually open the door toward $1,560s. Worse, longer-term, there is dual support at $1,360s – horizontal going back to the latter months of 2010 and a rising trendline from December 2015 when gold bottomed at $1,045.
Nasdaq 100 index (mini): Currently net short 48, up 3.5k.
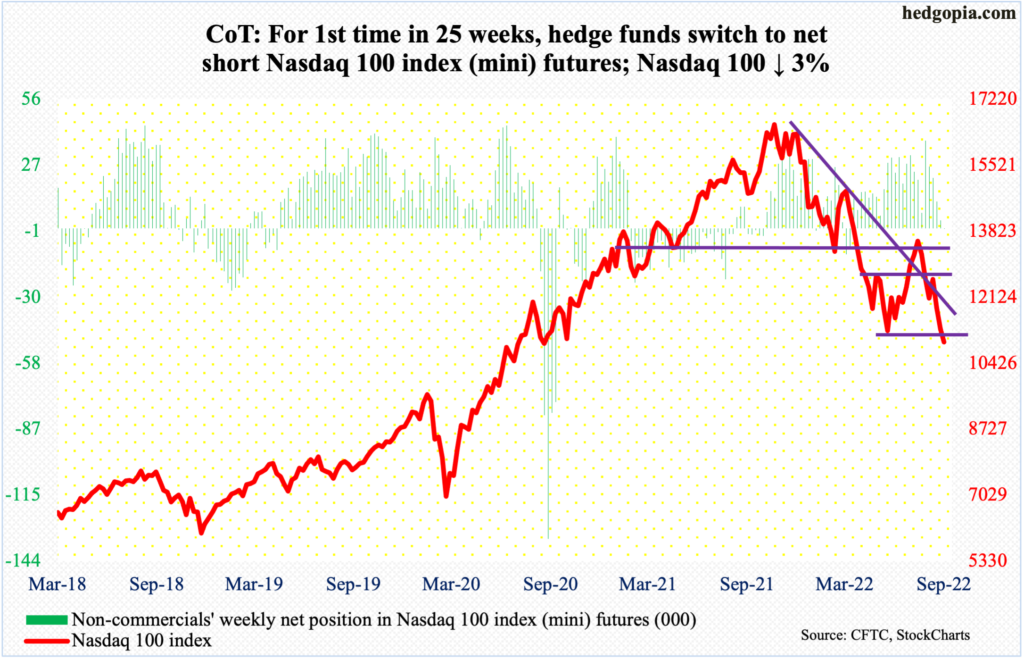
Until Thursday, tech bulls ably defended the lows from June. Come Friday, they could no longer pull off that feat, when the Nasdaq 100 closed at 10971; on June 16, the index tagged 11037 before reversing higher.
For bulls’ consolation, the breach of the June lows is not major – not yet anyway. The sooner they reclaim this, the better. Else, bears are probably eyeing 10589, which is a 61.8-percent Fibonacci retracement of the surge from March 2020 to last November’s record high. Should this come to pass, the tech-heavy index will have fallen 36.8 percent from the peak. Right now, through Friday’s low, it is down 34.5 percent.
Russell 2000 mini-index: Currently net short 106.1k, down 777.
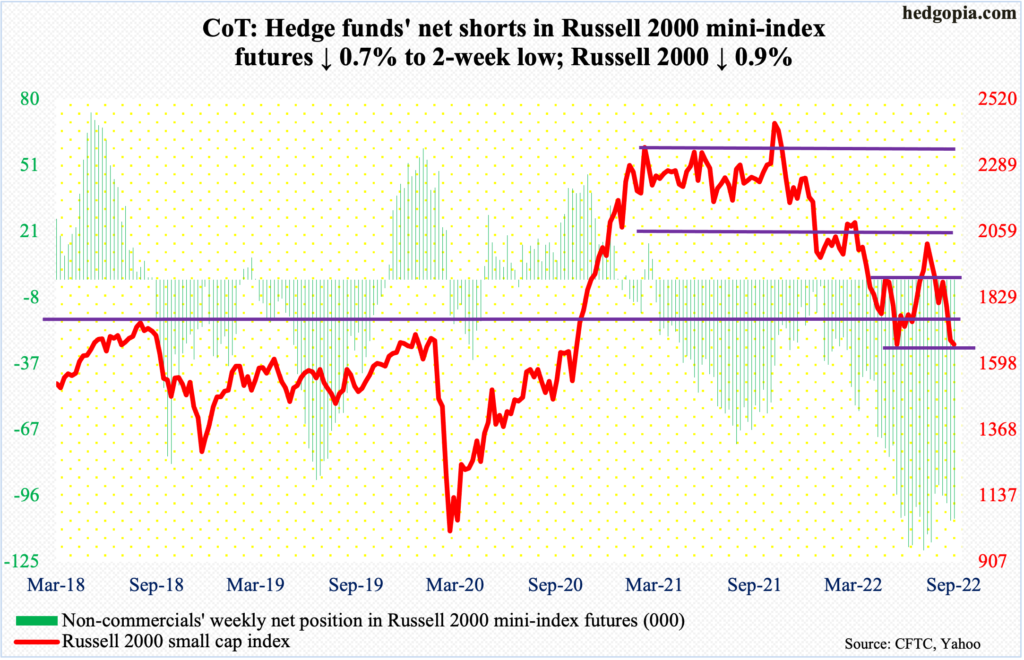
Small-cap bulls are hanging tough. Last Friday, the Russell 2000 closed at 1659. This Tuesday, the small cap index ticked 1651, closing the week at 1665. Unlike both the S&P 500 and Nasdaq 100, the June 16 low of 1641 is intact.
That said, it managed to close above 1700 just once – on Wednesday; 1700 is where the index broke out of in November 2020. Between mid-June and mid-July this year, the level was defended several times. A decisive recapturing of 1700 opens the door toward 1800, and then 1900.
To recall, a major breakdown occurred mid-January this year, losing 2080s; for 10 months before that, the Russell 2000 played ping pong between 2080s and 2350s, followed by a seesaw action between 2080s and 1900 and between 1900 and 1700 after that.
US Dollar Index: Currently net long 30.6k, up 2.6k.
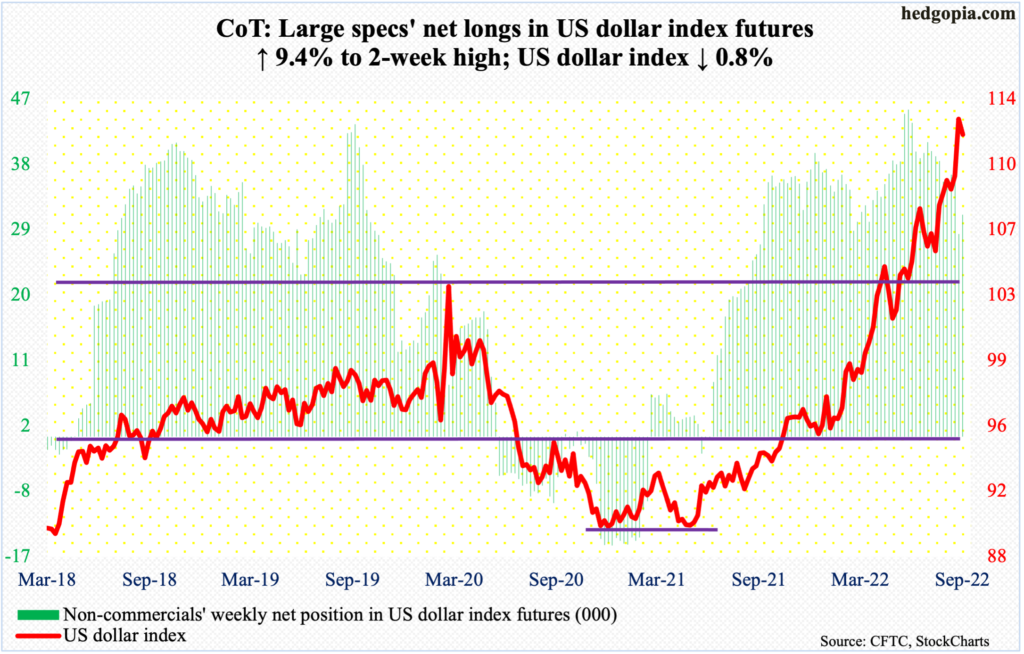
In September, the US dollar index rallied 3.1 percent – its fourth straight up month and eighth in the last nine – but still left behind a long upper wick. It rallied as high as 114.75 on Wednesday but reversed to end the week at 112.08, down 0.8 percent for the week.
This week’s action could very well prove to be an important reversal, but you never know. From 89.52 in May last year, it has come a long way, with several important breakouts to its credit.
Early last month, it witnessed a mini-break out of 109.10s. If and when this support gives way, 104 is the next level to watch; the index broke out of it in June.
VIX: Currently net short 82.7k, up 926.
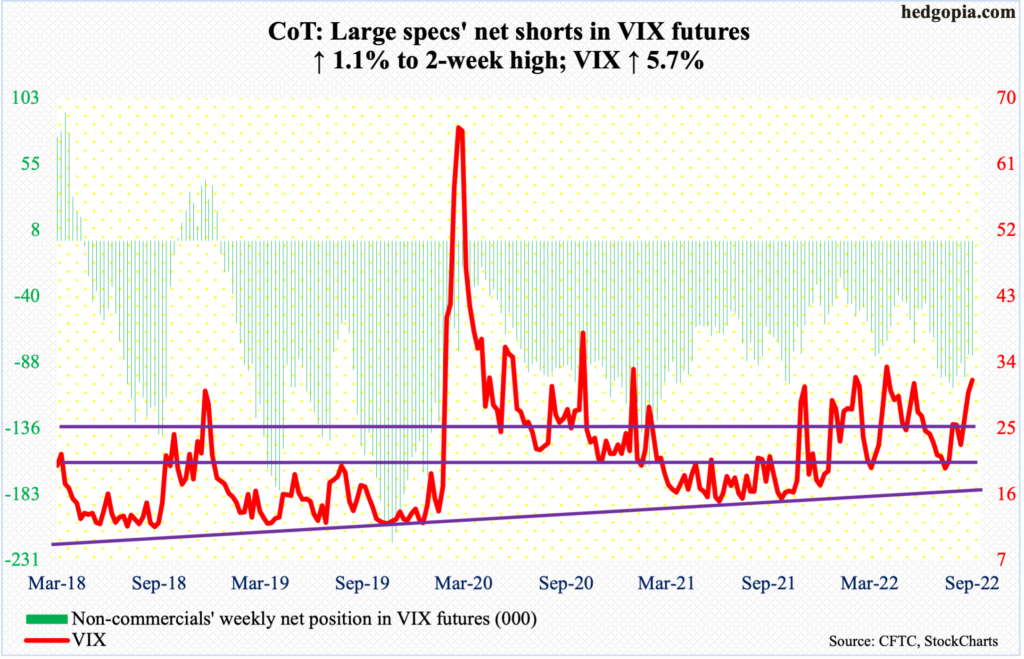
VIX shed 0.7 percent on Friday, forming a long-legged doji, even as the S&P 500 declined 1.5 percent. This is not normal, as these two tend to go the opposite ways. This could very well be a sign of things to come for next week.
On Wednesday, the volatility index rose as high as 34.88 but only to reverse hard to end the session at 30.18, producing a bearish engulfing candle; that high was the highest since 35.05 on June 13. Back then, VIX ended with a weekly spinning top, which also formed this week. If VIX acts anywhere close to how it acted back then when it fell for eight straight weeks, volatility is on a sustained way lower.
For whatever it is worth, at least until Tuesday, non-commercials were showing no hurry in covering their relatively large net shorts in VIX futures.
Thanks for reading!
More By This Author:
Investors Intelligence Bulls Lowest Since Feb ’16
CoT Report: Futures Positions Of Non-Commercials
CoT Report - Futures Positions Of Non-Commercials This Week


