
Measuring Global Economic Activity
Measuring the level of global economic activity is of key interest. But the measures we have on variables like industrial production don’t cover all countries and are only available with a significant lag. Michigan Professor Lutz Kilian suggested in an influential paper published in 2009 that we could get a useful timely indicator by looking at average shipping costs. I recently had a chance to look into the details of how that series is constructed and have some suggested improvements.
Kilian’s basic idea is that changes in world economic activity are the primary driver of the demand for shipping and that this higher demand shows up in the short run as an increase in the real cost of shipping. Kilian calculated a nominal index of shipping costs (which I’ll denote by x) by starting with a value for 1968:M1 of x = 1 and adding an average of the monthly change in the log of different shipping costs each month to get a new value for xt for each month t up to 2007:M12. Since 2008, Kilian has simply added the monthly change in the log of the Baltic Dry Index (BDI) of shipping costs to the previous month’s value of x. That procedure implies that for data since 2008,
(Click on image to enlarge)
![]()
The value of c0 turns out to depend on the value of x and of the BDI in 2008: M1. Kilian has never reported the values for x itself or the value of c0, but it is possible to uncover both exactly from data he has made public, as I describe in this note. The value of c0 turns out to be -5.236.
Kilian’s next step was to take the log of x, subtract off the log of the CPI, and regress the difference on a time trend:
(Click on image to enlarge)
![]()
The residuals from this second regression are Kilian’s index of real economic activity, which he regularly updates on his website and which have been used in dozens of economic studies.
One can see the consequences of this procedure by substituting the first equation into the second:
(Click on image to enlarge)
![]()
Readers of this blog know that I am a big fan of using logarithms in economics. But applying the log operator twice– taking the log of the log– is rarely something we would want to do. One implication of the procedure in the current setting is that the resulting index of real economic activity is a function of the arbitrary value at which the series for x was initialized. When we initialize x for 1968:1 equal to 1 as Kilian did, the value of c0 would be -5.236. If we instead set x for 1973:1 equal to 1, the value of c0 would be -5.694. The next graph shows how different the resulting series would be if we chose one or the other of these seemingly harmless normalizations.
(Click on image to enlarge)
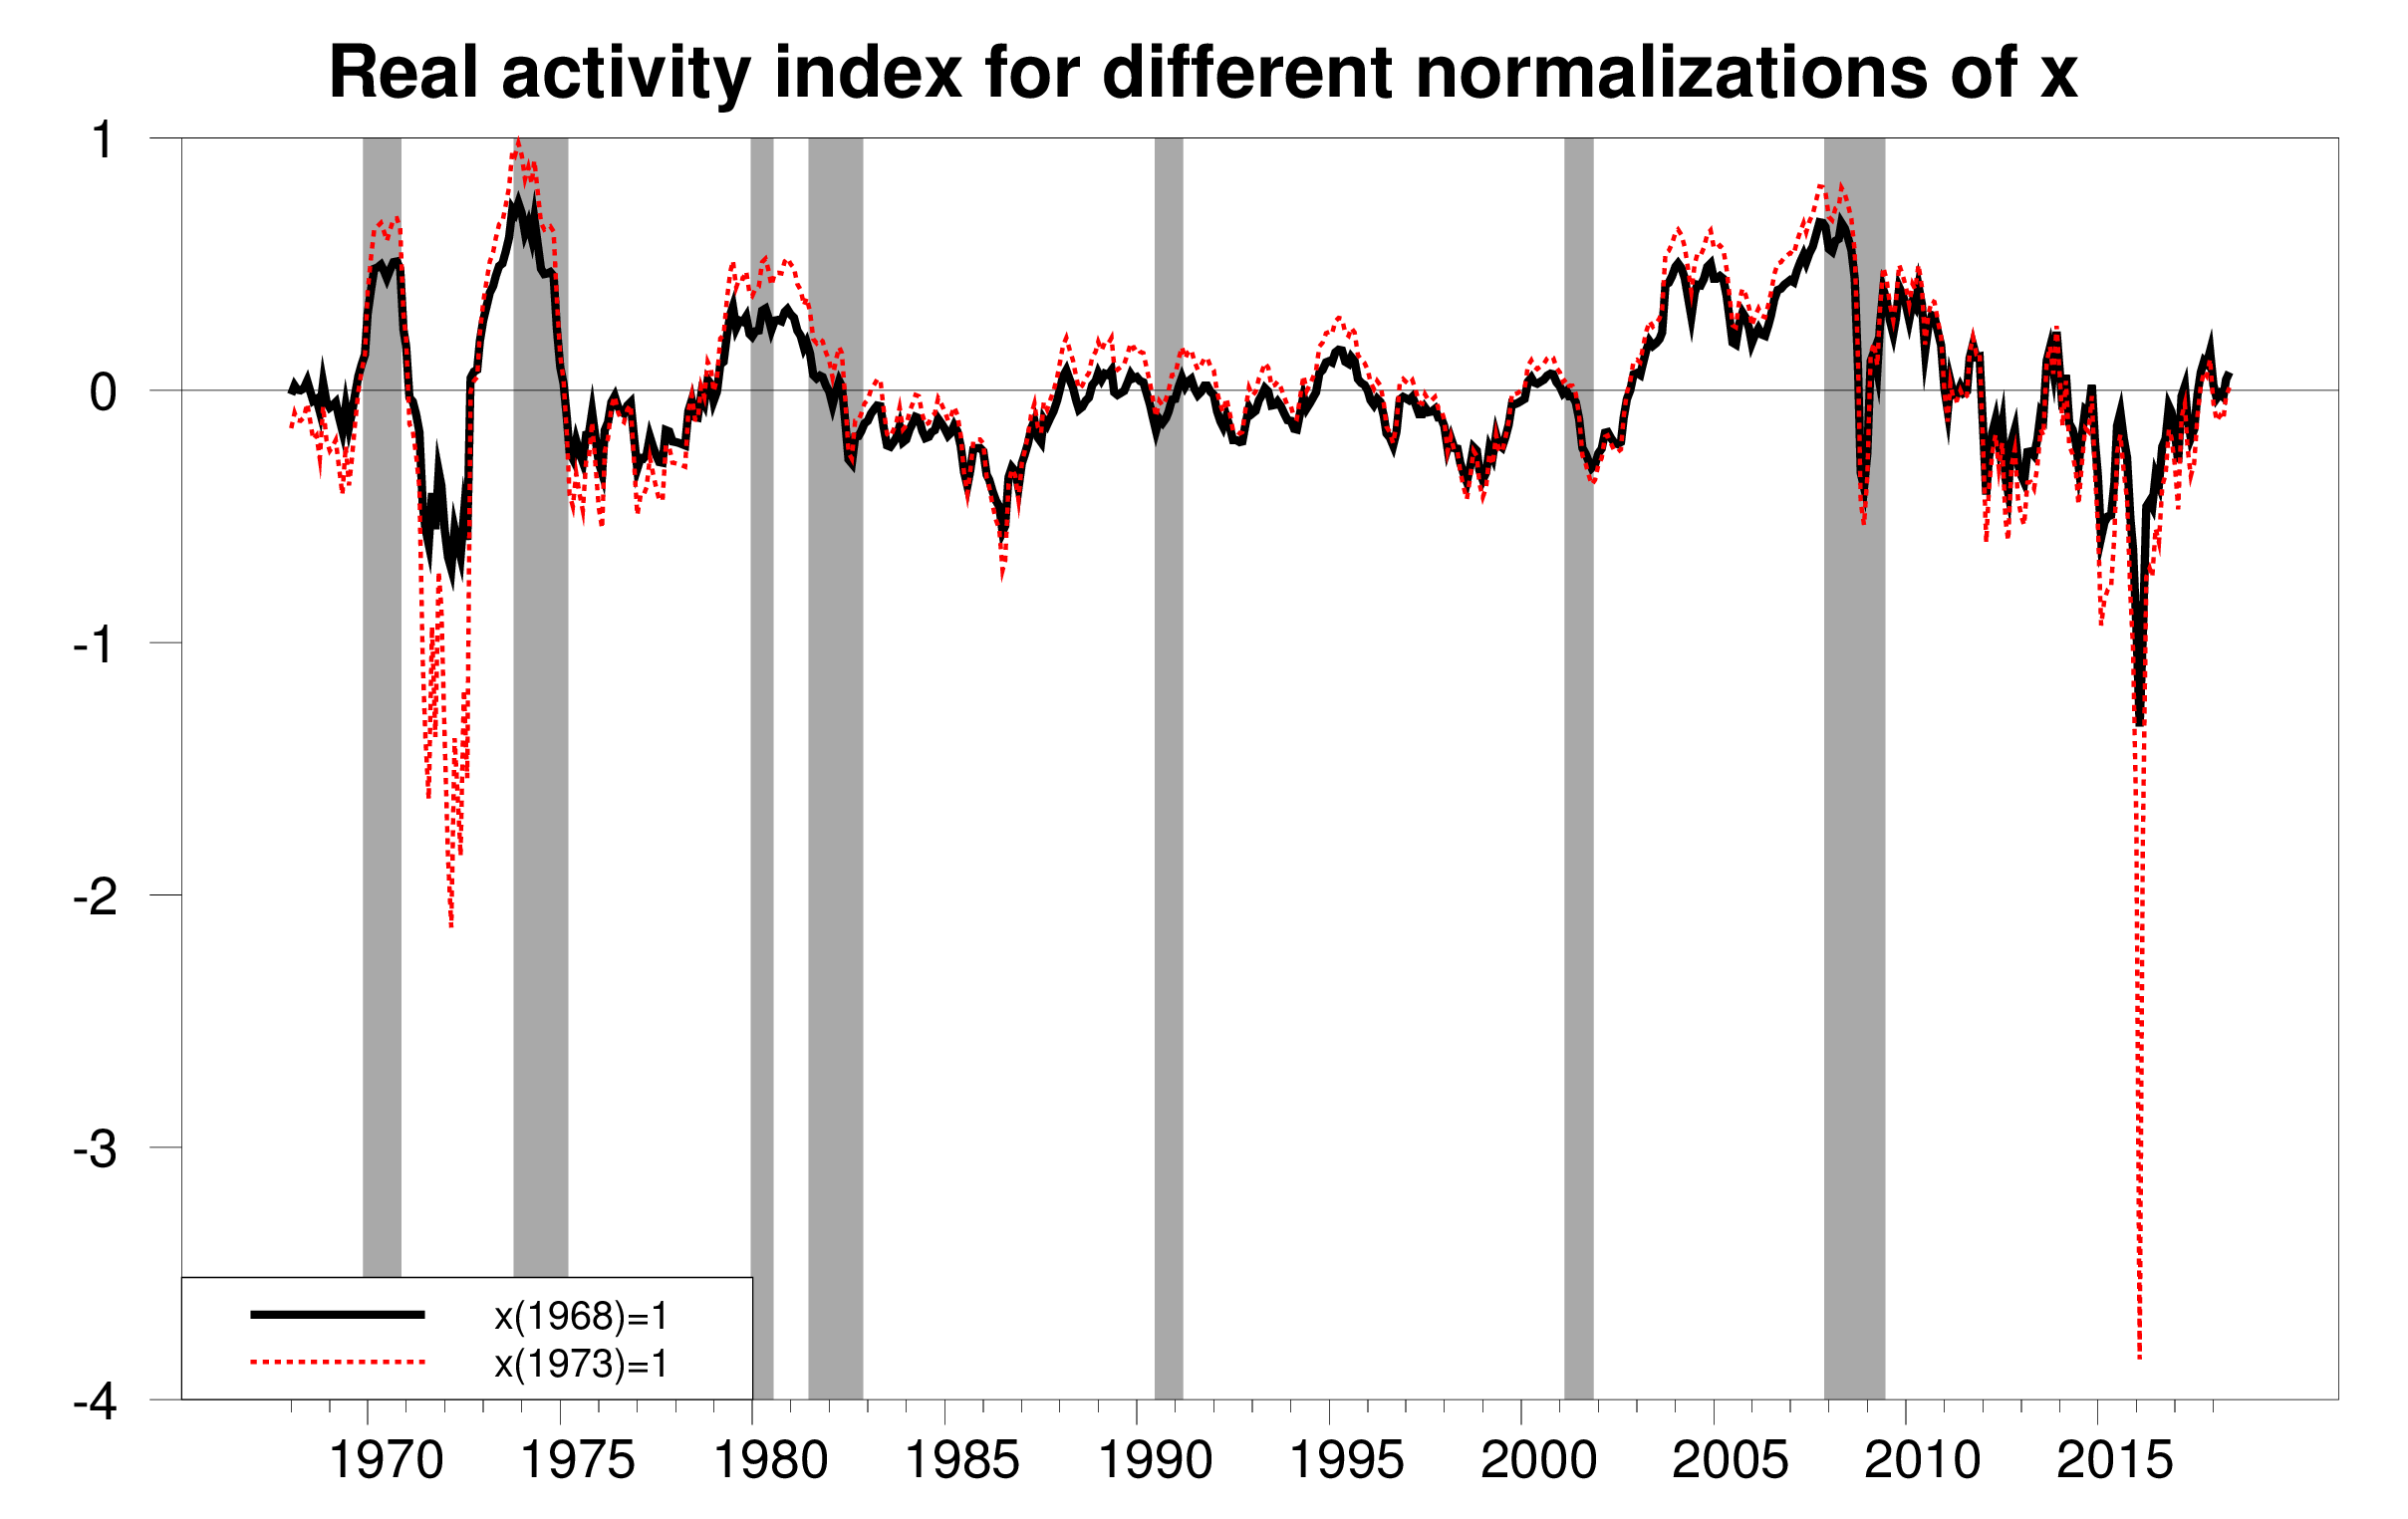
Real activity index resulting from two different starting values for x. Source: Hamilton (2018).
Does the index resulting from Kilian’s choice of c0 correspond to other things we know about global business conditions? The Kilian real activity index is reproduced in the top panel of the next figure. This series suggests that there was a drop in world economic activity in 2015 that was far more severe than that in either the financial crisis of 2008-2009 or the 1974-75 global recession. This conclusion seems hard to justify on the basis of output data we have for any major country.
(Click on image to enlarge)
Three different monthly measures of global real economic activity, 1960: M1 to 2018: M6. Top panel: Kilian measure. Middle panel: 2-year change in log of industrial production for OECD countries plus 6 others. Bottom panel: 2-year change in difference between x and the log of the CPI. Source: Hamilton (2018).
OECD Main Economic Indicators published an estimate of monthly industrial production for the OECD plus 6 other major countries (Brazil, China, India, Indonesia, the Russian Federation and South Africa). The OECD series ends in 2011:10, but in a recent paper with Christiane Baumeister, we reproduced the methodology by which the original OECD index was constructed to extend the series through 2017:12. In another recent paper, I suggested that taking the two-year change in the log of a series like this is a reasonable way to isolate the cyclical component. That estimate of the cyclical component of industrial production in the OECD plus 6 is plotted in the middle panel above. Unlike the Kilian measure, this series implies that the 1974-75 and 2008-2009 recessions were the most significant downturns in global real activity during this period. The series characterizes 2015 as sluggish growth rather than a separate severe global contraction.
If one wants to use the relative price of shipping as a measure of global activity, I recommend using simply the log of the relative price instead of the double-log transformation in Kilian’s measure. Since x is already in units of a constant plus the log of shipping costs, the log of the relative price is given simply by the difference between x and the log of the consumer price index. Two-year growth rates of the latter series are plotted in the bottom panel of the figure above.
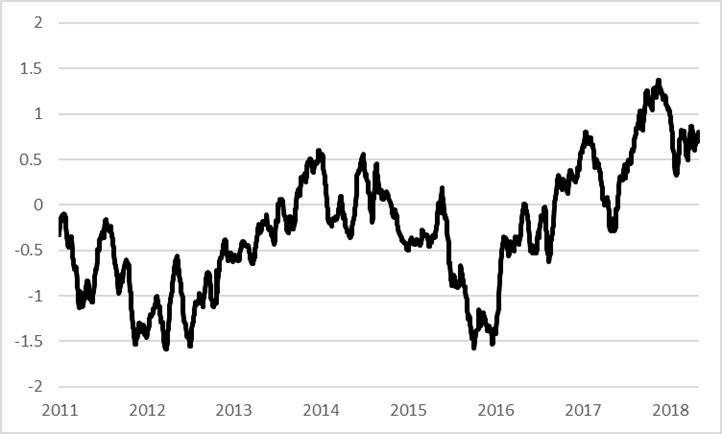
Since BDI is actually reported daily, one can use that same idea to get not just a monthly index of global real activity, but also daily, as I describe in my note. This series is plotted in the graph below.
(Click on image to enlarge)
Data for all these series and code to generate them are available on my webpage.
Disclosure: None.


