
May 2021 New York Fed Weekly Economic Index (WEI): Index Improvement Continues
The New York Fed's Weekly Leading Index (WLI) improved mostly due to the economic sharp deterioration which occurred one year ago. This index recovery is improving based on the 13-week rolling average.

Analyst Opinion of the Weekly Leading Index
This data set should be considered a high-frequency coincident indicator on a par with the Aruoba-Diebold-Scotti Business Conditions Index produced by the Philly Fed - and both show conditions caused by the coronavirus pandemic are already worse than the Great Recession. However, the Aruoba-Diebold-Scotti Business Conditions Index is improving whilst the WLI is still declining. Logic would say with the partial reopening of the economy - the Aruoba-Diebold-Scotti Business Conditions Index seems to be correct.
The WEI is an index of ten daily and weekly indicators of real economic activity scaled to align with the four-quarter GDP growth rate.

The current situation according to the New York Fed:
The increase in the WEI for the week of May 1 reflects increases in tax withholding and electricity output, which more than offset an increase in initial unemployment insurance claims and decreases in fuel sales and rail traffic (relative to the same time last year). Because the WEI measures changes over a 52-week period, the large positive reading also reflects the sharp deterioration in economic conditions during the same time last year.
What is the Weekly Economic Index (WEI)?
The WEI is an index of real economic activity using timely and relevant high-frequency data. It represents the common component of ten different daily and weekly series covering consumer behavior, the labor market, and production. The WEI is scaled to the four-quarter GDP growth rate; for example, if the WEI reads -2 percent and the current level of the WEI persists for an entire quarter, we would expect, on average, GDP that quarter to be 2 percent lower than a year previously.
Comparision to the Aruoba-Diebold-Scotti Business Conditions Index
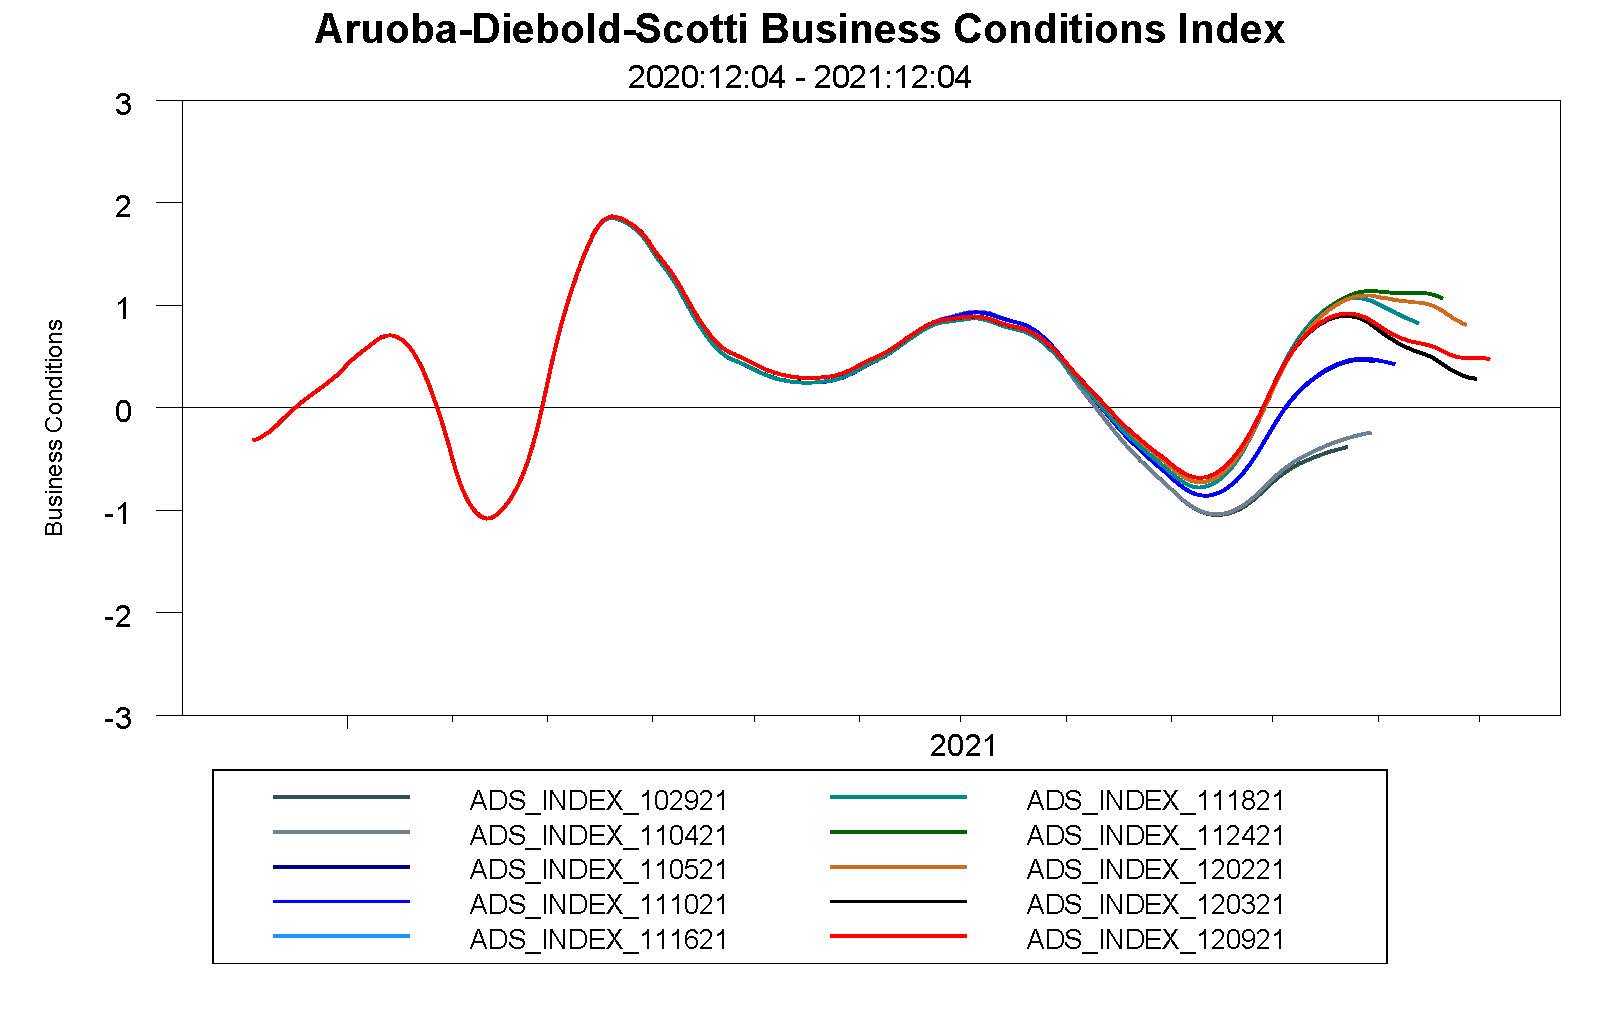
Components of the Aruoba-Diebold-Scotti Business Conditions Index
The Aruoba-Diebold-Scotti business conditions index is designed to track real business conditions at high observation frequency. Its underlying (seasonally adjusted) economic indicators (weekly initial jobless claims; monthly payroll employment, monthly industrial production, monthly real personal income less transfer payments, monthly real manufacturing and trade sales; and quarterly real GDP) blend high-frequency and low-frequency data. The ADS index on this web page is updated in real time as new or revised data on the index's underlying components are released. Hence at the time of any ADS update, the index is based on all information on all indicators available at that time.
The average value of the ADS index is zero. Progressively bigger positive values indicate progressively better-than-average conditions, whereas progressively more negative values indicate progressively worse-than-average conditions. The ADS index may be used to compare business conditions at different times. A value of -3.0, for example, would indicate business conditions noticeably worse than at any time in either the 1990-91 or the 2001 recession, during which the ADS index never dropped below -2.0.
source: New York Fed
Disclaimer: No content is to be construed as investment advise and all content is provided for informational purposes only.The reader is solely responsible for determining whether any investment, ...
more

