
Masco – An Example Of How Bench Marking Volume Can Highlight Anomalous Price Action
The daily chart for Masco with the ticker MAS is another example of where we have anomalous price action, but in this case, it is the inverse of what we observed with FAST and perhaps not as obvious.
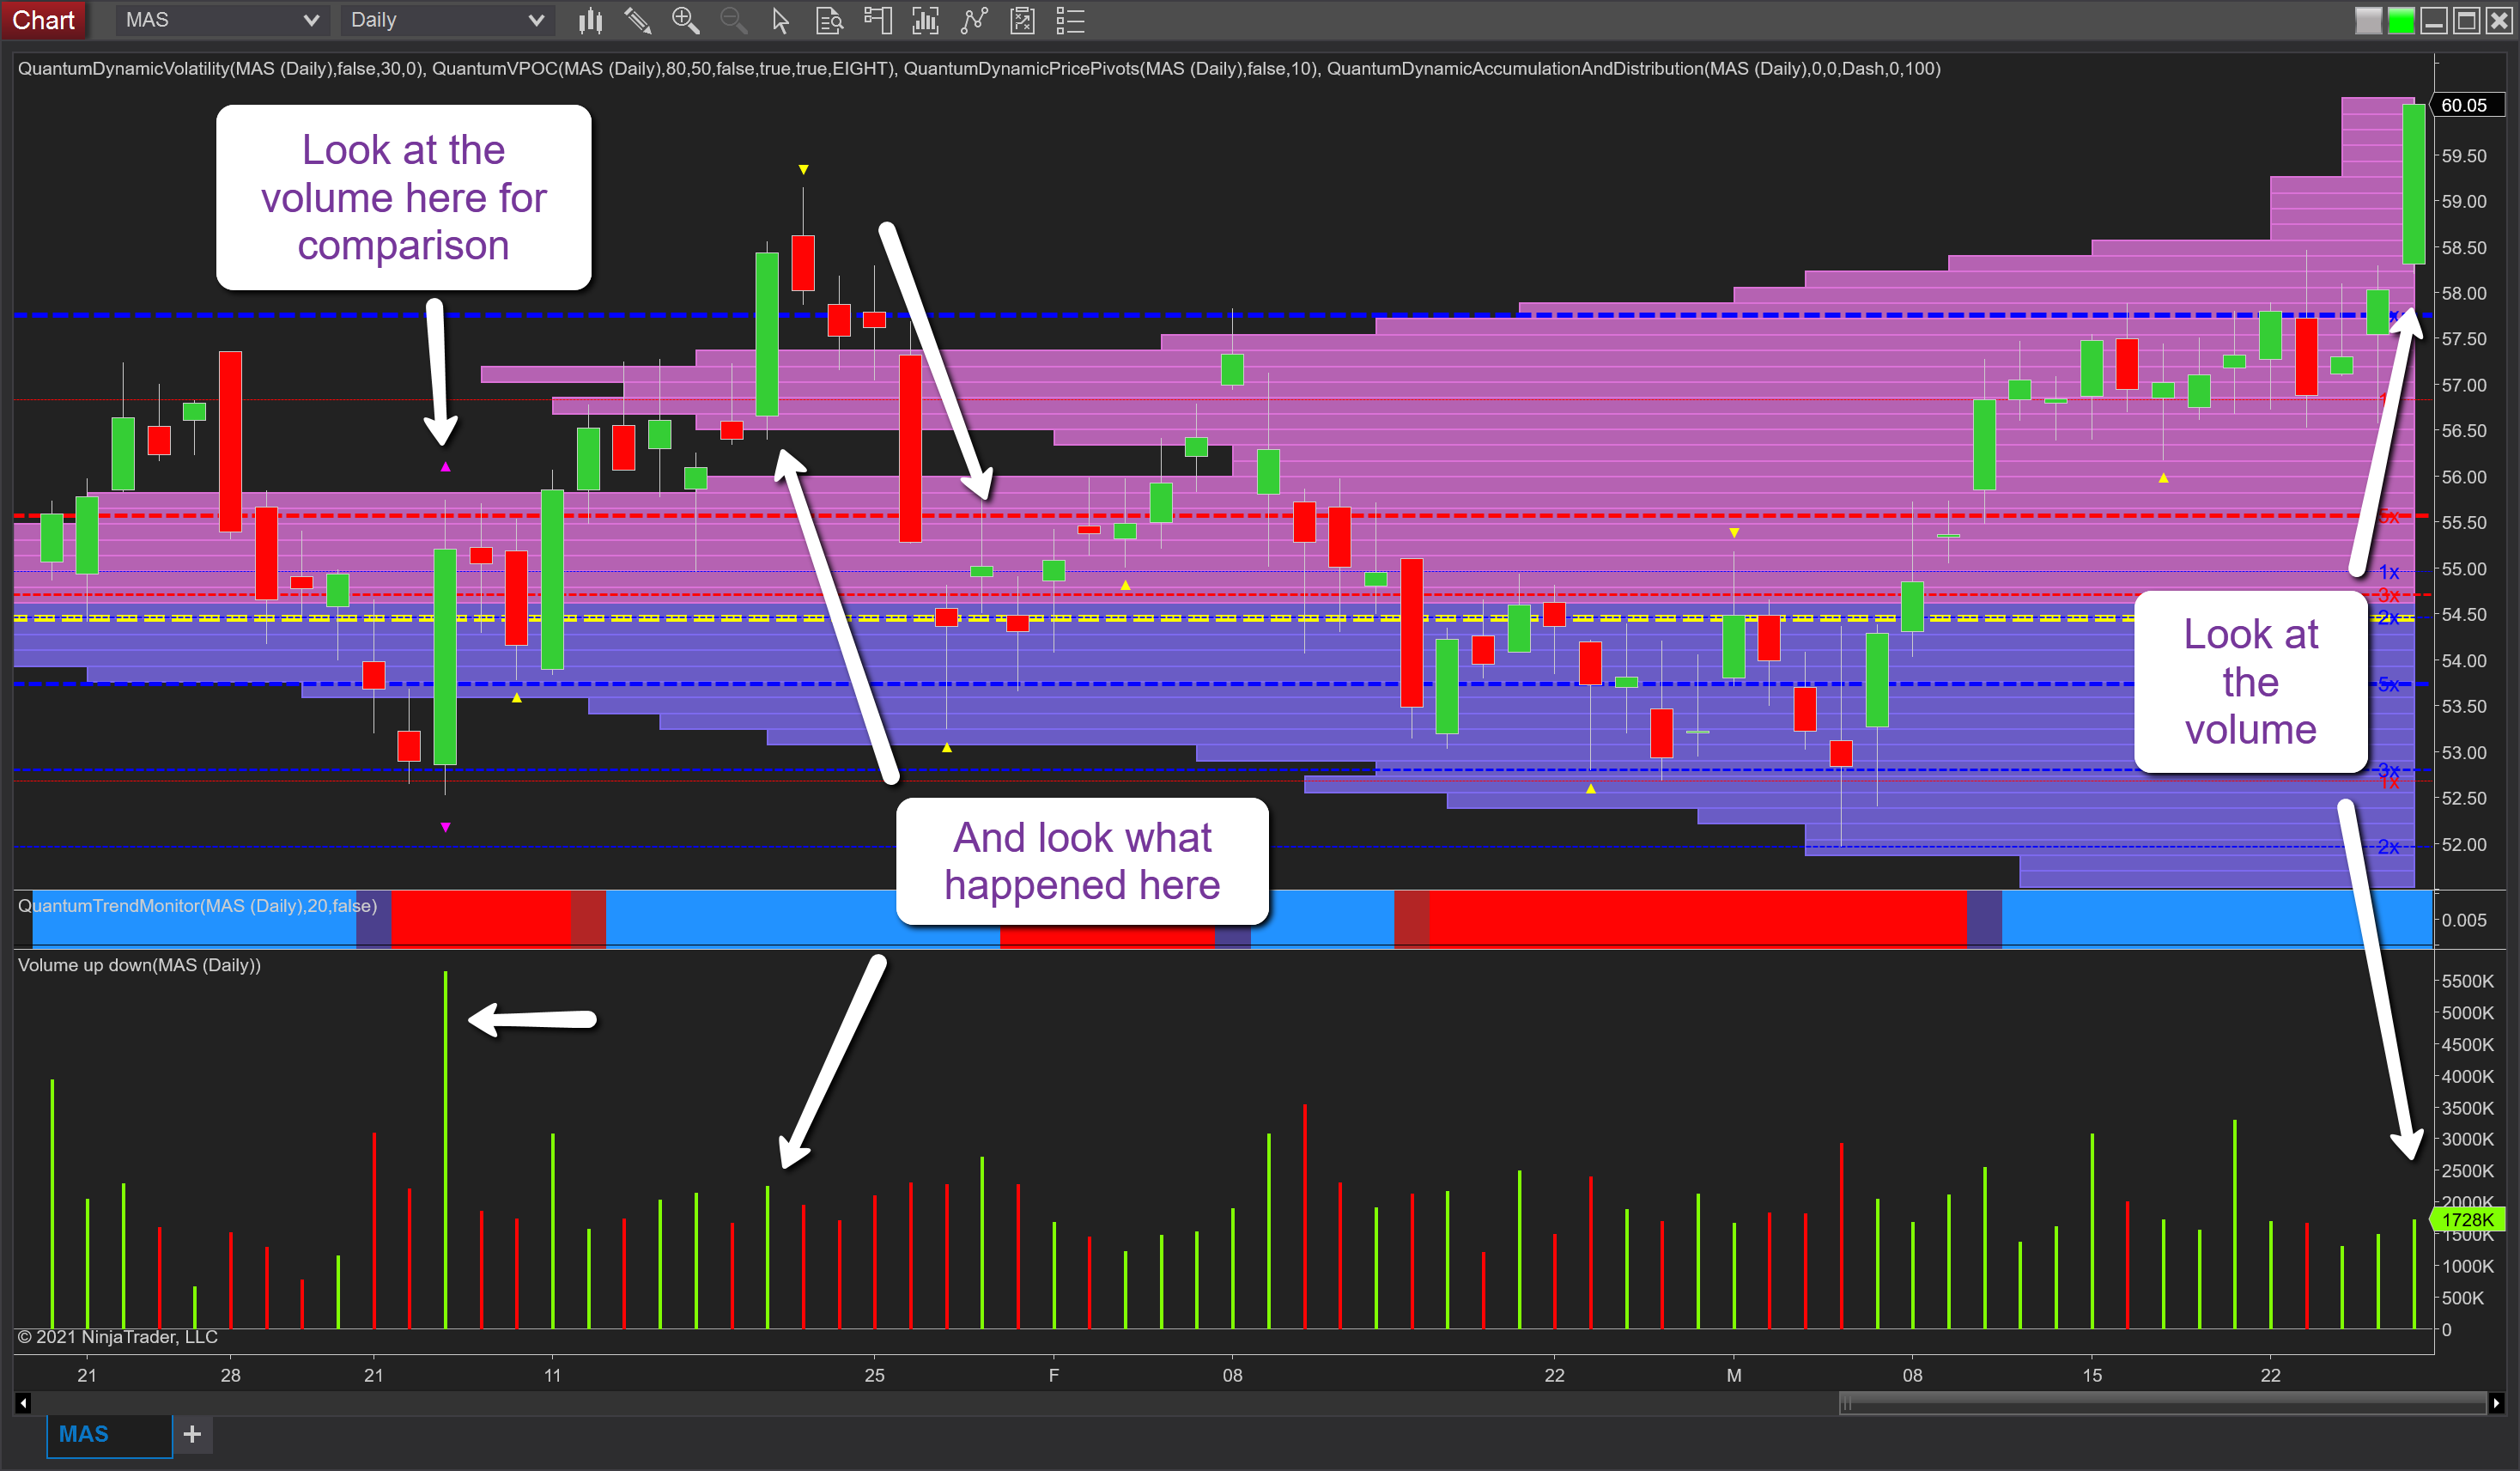
But first, let’s examine Friday’s price action for this stock, and here we have a solid wide spread-up candle that took the price from $58.31 per share to close the week at $60.05. However, look at the volume associated with the price move and consider whether it makes sense. In this example, we have almost a $2 per share gain in price on volume which looks at best to be average. Indeed, when we compare it to the volatility candle of the 6th of January this gives us an excellent benchmark of the volume we should have expected. In addition, note the widespread candle of the 20th January which looks to be a mirror image of Friday’s candle and which resulted in a reversal for Masco. In this case and as was the case on Friday, the volume is sending us a clear signal. First, it is anomalous, and second, if the market makers are not participating, then this looks like a trap move with the likelihood of a reversal ahead.
(Click on image to enlarge)
Disclaimer: Futures, stocks, and spot currency trading have large potential rewards, but also large potential risk. You must be aware of the risks and be willing to accept them in order to invest in ...
more

