
Markit Services PMI: "Slowest Increase In New Business Since March 2016"
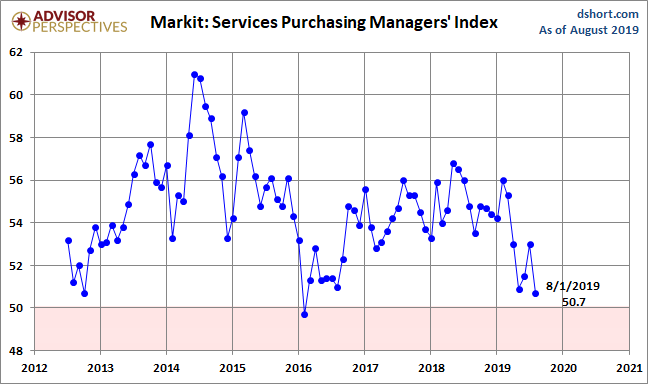
The August US Services Purchasing Managers' Index conducted by Markit came in at 50.7 percent, down 2.3 from the final July estimate of 53.0. The Investing.com consensus was for 50.9 percent. Markit's Services PMI is a diffusion index: A reading above 50 indicates expansion in the sector; below 50 indicates contraction.
Here is the opening from the latest press release:
Commenting on the PMI data, Chris Williamson, Chief Business Economist at IHS Markit said:
“US businesses reported one of the toughest months since the global financial crisis in August, with growth of output, order books and hiring all slowing amid steep falls in both export and business confidence.
“Only on two occasions since the global financial crisis have the US PMI surveys recorded a weaker monthly expansion, and these were months in which business was hit by the government shutdown and bad weather in 2013 and 2016 respectively. This time, trade wars and falling exports appear to be the main drivers of weakness, exacerbating fears of a broader economic slowdown both at home and globally.
“At current levels, the August PMIs are indicating annualized GDP growth of 1.0%, putting the economy on course for growth of just below 1.5% in the third quarter. Such weak readings hint at downside risks to current third quarter growth projections, which generally point to an expansion of just over 2%.
“A major factor behind the deterioration was the spreading of the manufacturing downturn to the service sector, via weakened household and business confidence. Jobs growth is also increasingly being affected by worries regarding the outlook. Overall jobs growth in August was the weakest since early-2012, commensurate with non-farm payrolls rising at a monthly rate of under 100,000.” [Press Release]
Here is a snapshot of the series since mid-2012.
(Click on image to enlarge)
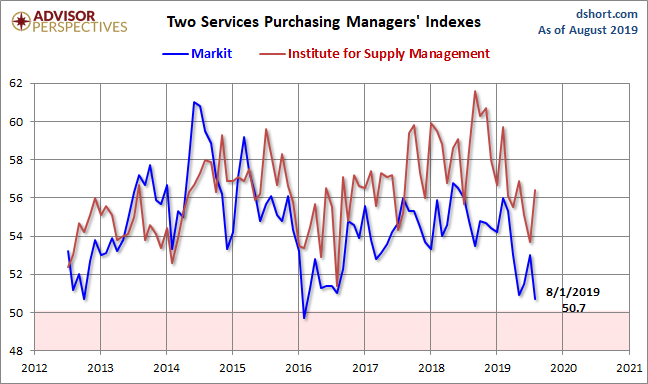
Here is an overlay with the equivalent PMI survey conducted by the Institute for Supply Management, which they refer to as "Non-Manufacturing" (see our full article on this series here). Over the past year, the ISM metric has been significantly the more volatile of the two.
(Click on image to enlarge)
The next chart uses a three-month moving average of the two rather volatile series to facilitate our understanding of the current trend. Since early in 2016, the ISM metric has shown stronger growth than the Markit counterpart.
(Click on image to enlarge)
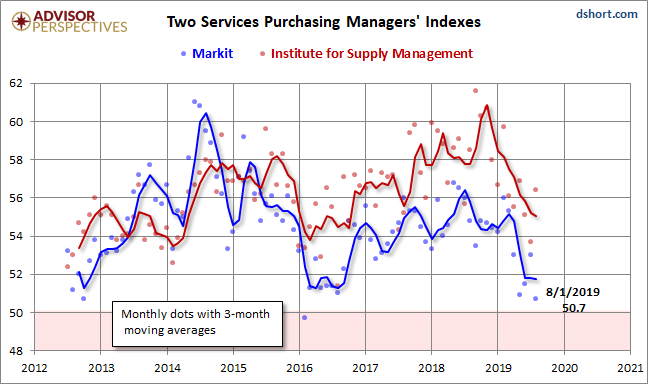
Both series weakened since 2015 and saw an uptick in the latter half of 2016. The interim three-month moving average of the Markit Services index peaked in August of 2014. The ISM index peaked in September of 2015. The two were fairly closely aligned at the beginning of 2016, but they diverged early with the Markit index signaling noticeably weaker growth.


