
BTC/USD: Still Struggling To Recover
Ever since the heavily discussed “crypto winter” flowed through the financial markets into the early months of 2019, traders of digital currencies have been wary of its potential return. Of course, there is a particular vulnerability that is often tied to these assets because they lack inherent value and they are unable to generate earnings in the ways stock investors tend to enjoy. In addition to this, market valuations in BTC/USD have fallen off a cliff since the end of September and likely price support may not be seen until we reach the mid-7000 levels.
(Click on image to enlarge)
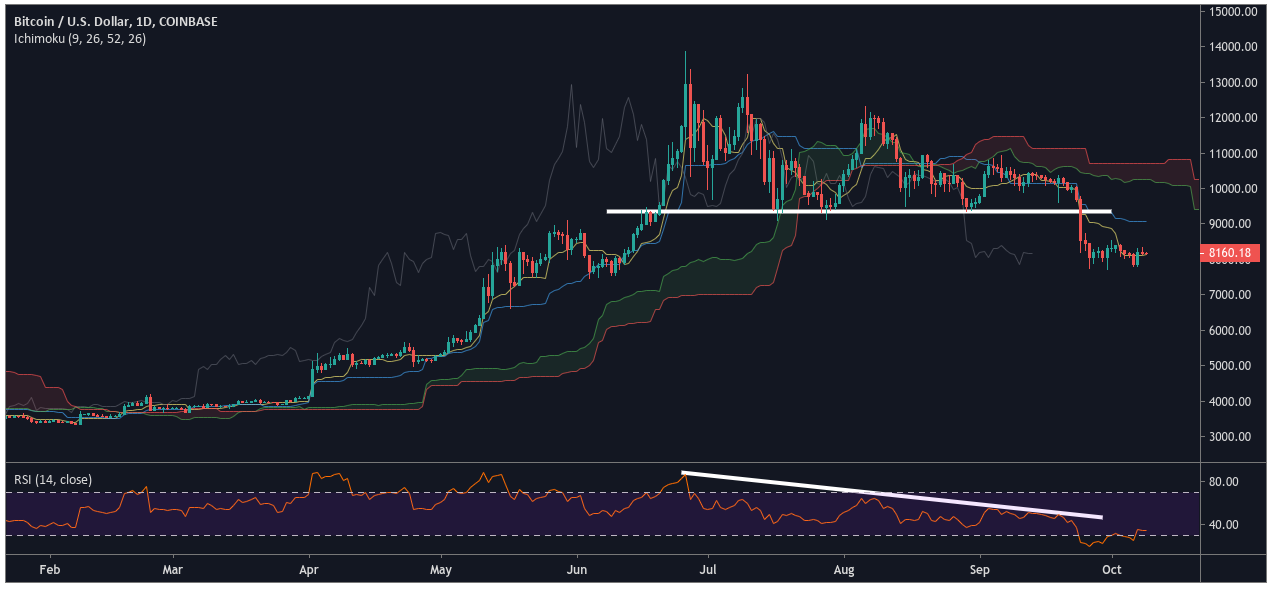
From a technical perspective, the daily price history in BTC/USD is a very scary sight for anyone that is currently holding a long position. Ichimoku analysis shows that the Conversion Line (Tenkan-Sen) has made a wide break below the Base Line (Kijun-Sen). Readers that follow my Ichimoku analysis know that I tend to view these events as leading price indicators and the external RSI is showing a heavily bearish reading as these moves have occurred. At this stage, it would take a significant bull rally in order for prices to reach back above the Kumo and alleviate the downside pressure that currently rests on the BTC/USD pairing.
For newer readers (or those less familiar with this form of analysis), I have explained each of these terms with an in-depth Ichikomu Trading Tutorial that crypto traders might find informative. When I define the specific price parameters that are to be used in my individual trading strategies, I begin with a daily price history as a way of assessing the trend. Following this analysis, I zoom into the hourly price history as a way of finding specific triggers that can be used in positioning.
(Click on image to enlarge)
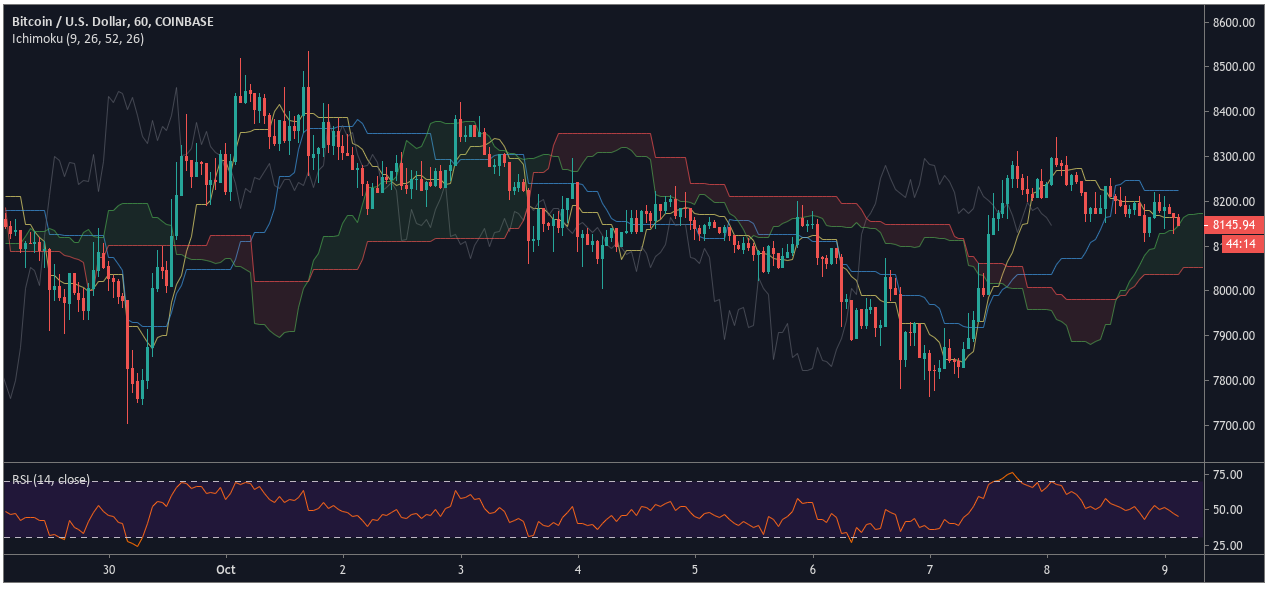
From the shorter-term perspective, the BTC/USD pairing looks a bit more constructive as a lower range seems to be forming while RSI readings have posted a higher base (moderately bullish signal). The hourly perspective shows us that prices are actually holding above the Kumo, which remains positive (green in color). As long as markets are able to find some additional support in this region, we could see the lower trading range break to the topside and this would put a test of resistance at $8,532.10 squarely in focus.
(Click on image to enlarge)

We’ll notice that similar price structures have also developed in the major Ethereum pairing (ETH/USD). This is interesting because a $6 billion United Nations Agency recently launched a crypto fund tied to the values of both BTC and ETH. Essentially, this marks a fundamental confluence of events that has helped both cryptocurrencies move higher in the process. The short-term price moves that are visible on the hourly charts show a bounce from support levels defined by the rising Kumo structure. In this case, major price resistance now rests at $185.15 and an upward breakthrough this level would be significant because it represents a double-top pattern on the hourlies. Indicator readings on the RSI suggest that prices could travel much higher before becoming overbought and this brings another sign of encouragement for crypto bulls with current long positions.
Overall, we should take these price movements as a suggestion that the recent declines might be attempting to form a lower base. Traders adopting a long-term viewpoint might see this as an opportunity to initiate contrarian long positions based on the fact that instruments like BTC/USD haven’t traded this low since June. That said, it’s prudent to keep stop losses relatively tight because the daily price histories still show a strong level of momentum that could keep downside pressure on BTC/USD.


