
Trading Recap On E-Mini S&P 500
We quickly start off with the plain daily perspective on the E-mini S&P 500 Futures contract (SPX / ES). Looking at this timeframe we can identify the gap which got filled later on in today's session. We can also see yesterday's flat top close without wick on the top which is a sign (higher probability) of a possible revisit of this particular level. Furthermore, we can observe the support from the developing Yearly VWAP VAL level which was confluent with the middle of the prior balance area. With all of this, we were more likely to be bullish on this market in the early overnight session.
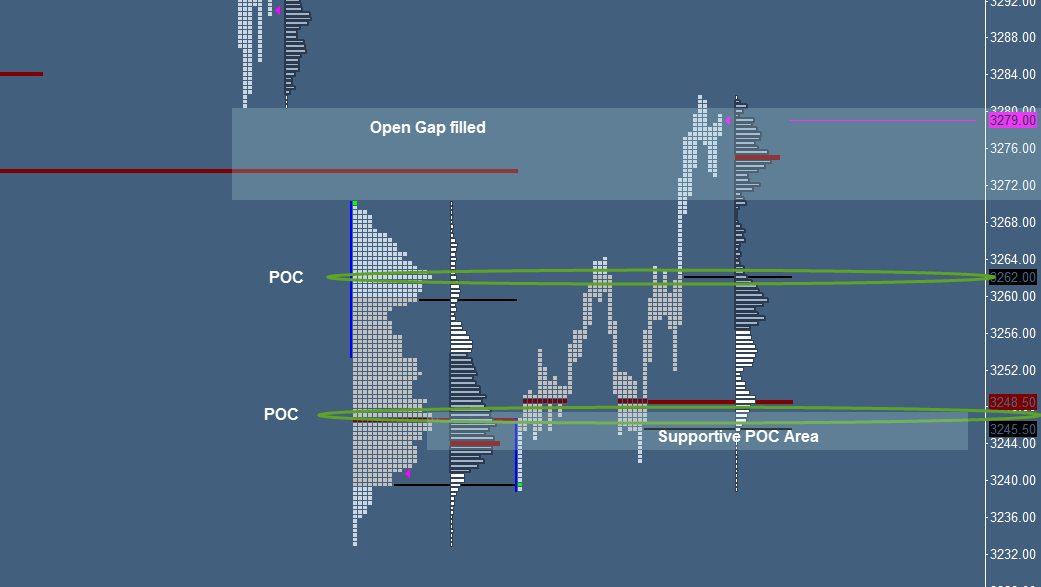
Taking a look at the daily TPO structure we can observe quite a rotational behavior as gap days tend to be balanced - so we should lean us on the extremes (high and low areas of the balance or bracket). Yesterday the market closed TPO based with a double distribution profile (tends to be rotational between the high TPO or POC levels) and volume-based as a b-shaped profile (tends to be a bullish sign at open or break above value). The open was below value but moved through the whole area to pullback back into value in order to find support around the VPOC and POC.
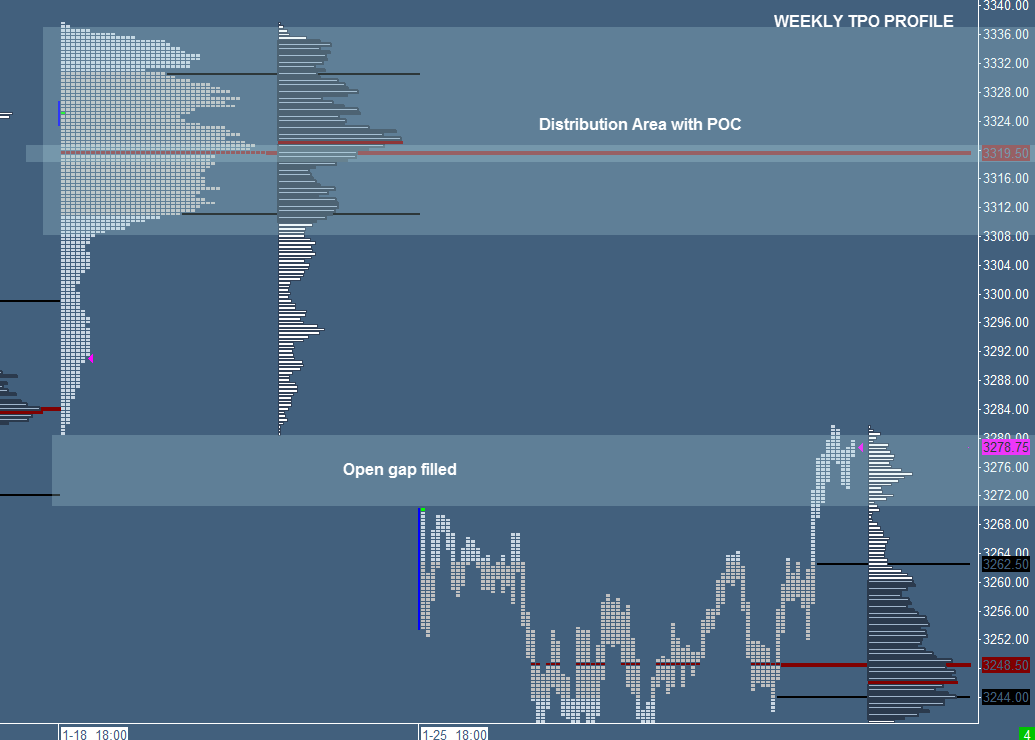
Glaring at the weekly TPO profile we can see a p-shaped profile which tends to be bearish at an open below POC which is the case, however, a test/pullback to the POC or the VAL close level could be still probable.
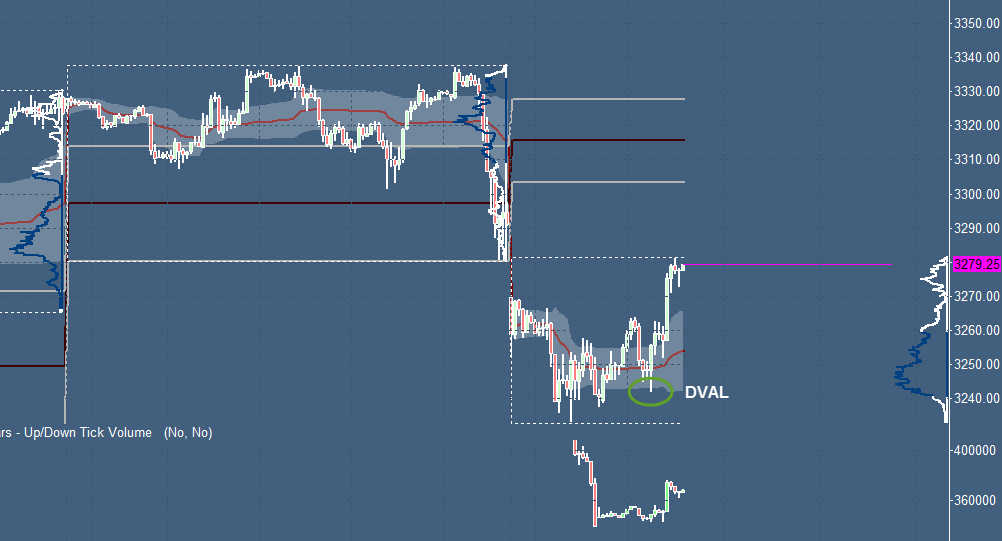
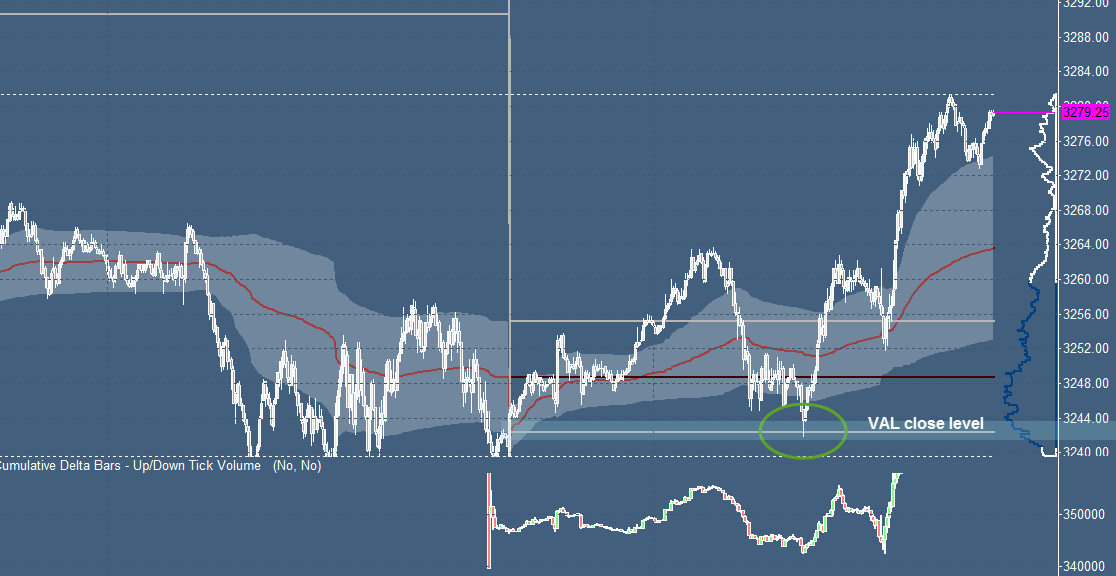
Looking at the weekly VWAP perspective we can see the rotational behavior between the first standard deviation levels of the VWAP. As mentioned the best is to lean on the extremes of the balanced area in such gap scenarios. The market found support at the DVAL which was confluent with the mentioned POC area from the TPO profile. Moving forward to the daily VWAP we can observe the rotational behavior and the support from the VAL close level which was confluent with all the discussed levels.
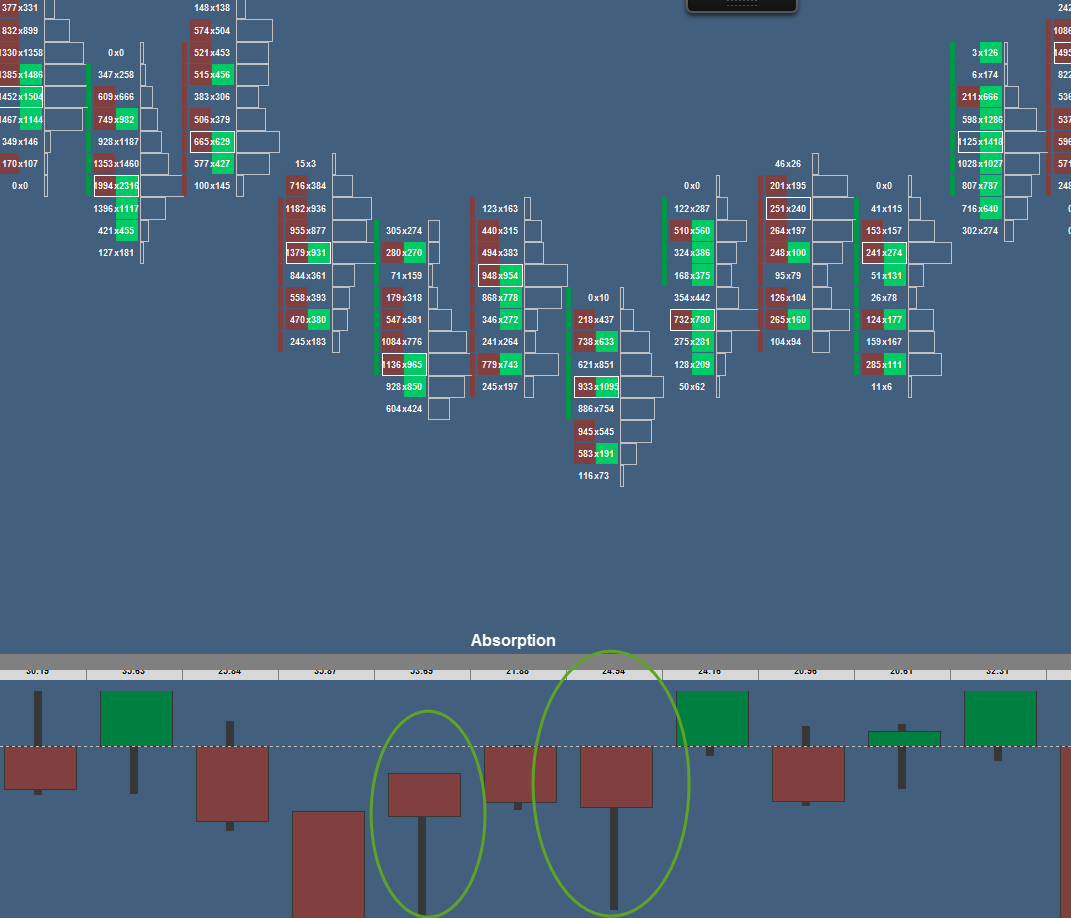
Additionally to all of this, we were able to identify absorption with the Volume at Price/Footprint chart around the desired trading level/area.
(Click on image to enlarge)

(Click on image to enlarge)
(Click on image to enlarge)
(Click on image to enlarge)
(Click on image to enlarge)
(Click on image to enlarge)
Visit our trading community to learn a more indepth analysis process with various tools such as the VWAP or Footprint chart.
Disclosure: ...
more

