IOTA Is Showing A Bullish Setup
IOTA was very bullish in March and April, clearly with five waves up and it's one of the cryptocurrencies, which already shows bullish pieces of evidence after long and deep three-wave A-B-C correction in May and June. Remember, five waves indicate the trend, but three waves only a correction.
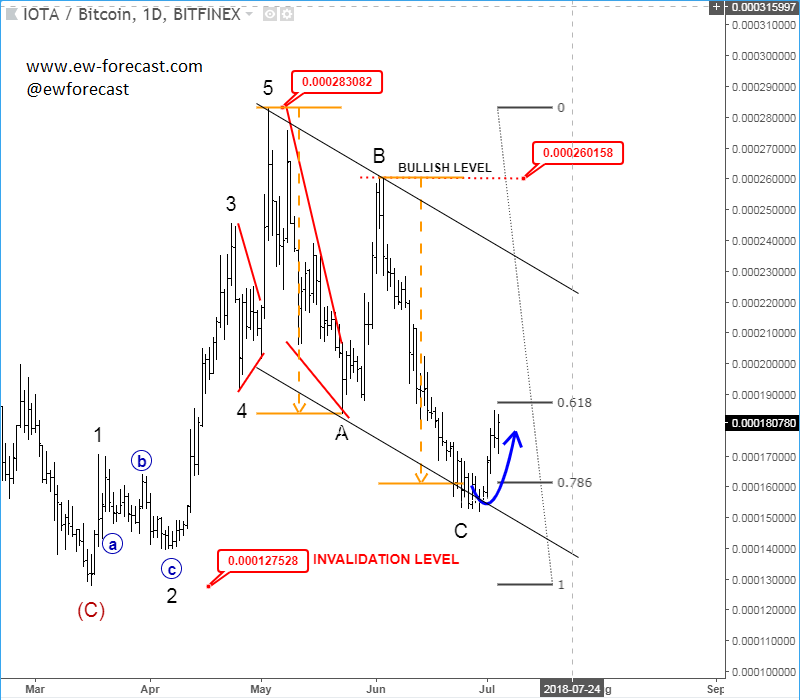
Looking at the daily chart, we see a sharp and impulsive rally in five waves, which in most cases indicate the trend, in this case – bullish trend. But later we see only three corrective waves within channel range, which in EW theory suggest a temporary pause before a trend continuation. Just keep an eye on 0.00026 level, which would be a confirmation of a bullish trend and once it will be broken, it could see much higher levels, maybe even all-time highs.
IOTBTC, Daily
(Click on image to enlarge)
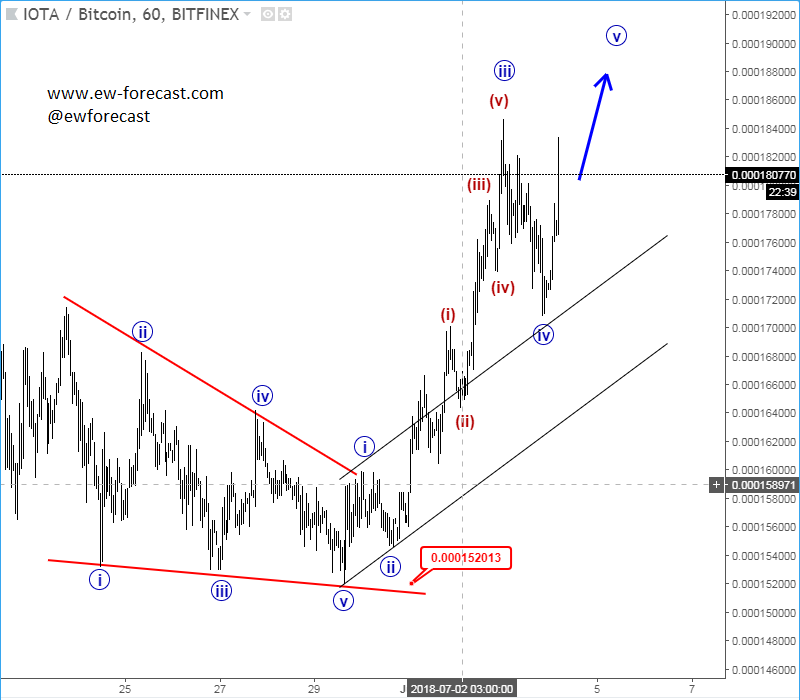
So, the price can be now turning away from 78,6% Fibonacci retracement, which can be an ideal reversal zone, especially if we take a look on the hourly chart, where we can see an impulsive bounce followed by five waves, so more upside is expected after a small pullback, while trading above 0.0001520. Even if goes back below that level, we will remain bullish as long as it's trading above 0.0001275 invalidation level.
IOTBTC, Hourly
(Click on image to enlarge)