
March 2021 Headline Manufacturing New Orders Improve

US Census says manufacturing new orders improved month-over-month with unfilled orders again improving. Our analysis shows the rolling averages improved and remain in expansion.
Analyst Opinion of Census Manufacturing Sales
According to the seasonally adjusted data, there was improvement across the board EXCEPT civilian and defence aircraft which significantly declined.
Of course, the year-over-year growth spurt is mostly due to the comparison to the lockdown period one year ago.
(Click on image to enlarge)

- The seasonally adjusted manufacturing new orders improved 1.1 % month-over-month.
- Market expected (from Econoday) month-over-month growth of -0.7 % to 3.2 % (consensus 1.3 %).
- Manufacturing unfilled orders were down 3.2 % year-over-year.
Econintersect Analysis:
- Unadjusted manufacturing new orders growth accelerated 16.9 % month-over-month, and up 17.6 % year-over-year.
- Unadjusted manufacturing new orders (but inflation-adjusted) up 9.6 % year-over-year.
- Three-month rolling new order rolling averages accelerated 5.4 % month-over-month and up 5.6 % year-over-year.
- Unadjusted manufacturing unfilled orders accelerated 2.5 % month-over-month, and down 3.2 % year-over-year
- As a comparison to the inflation-adjusted new orders data, the manufacturing subindex of the Federal Reserves Industrial Production growth was down 3.1 % month-over-month, and down 3.8 % year-over-year.
Seasonally Adjusted Manufacturing Value of New Orders - All (red line, left axis), All except Defense (green line, left axis), All with Unfilled Orders (orange line, left axis), and all except transport (blue line, right axis)
(Click on image to enlarge)

The graph below shows sector growth year-over-year.
Year-over-Year Change Manufacturing New Orders - Unadjusted (blue line) and Inflation Adjusted (red line)
(Click on image to enlarge)

Now, look at the manufacturing component of industrial production. While it is true that these are slightly different pulse points (inventory not accounted in shipments) - they should not have different trends for long periods of time.
Comparing Unadjusted Year-over-Year Change - Manufacturing Industrial Production (blue line) to Inflation-Adjusted Manufacturers Shipments (red line)
(Click on image to enlarge)

Using employment to confirm manufacturing growth says this industry's growth is contracting.
Employment Growth - Manufacturing (Seasonally Adjusted) - Total Employment (blue line) and Year-over-Year Change (red line)
(Click on image to enlarge)

The health of manufacturing is gauged by the growth of unfilled orders. The 3-month rolling average rate of growth is currently slowing and in contraction.
Unadjusted Unfilled Orders - Total Current Value (blue line, left axis) and Year-over-Year Change (red line, right axis)
(Click on image to enlarge)
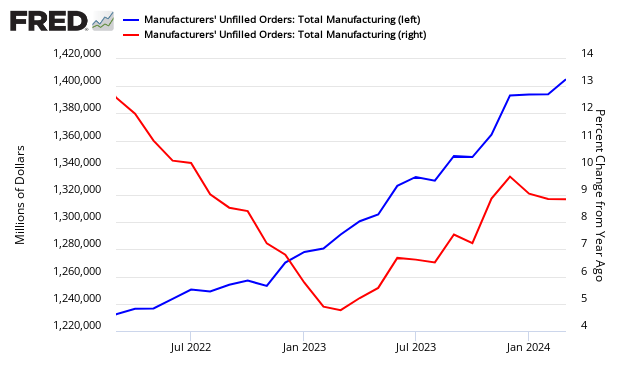
A declining unfilled orders backlog could be a recessionary indication as unfilled orders generally decline in poor economic times. Keep the score on surveys, the following is a comparison of surveys to hard data - this Census data is the orange bars.

Caveats on the Use of Manufacturing Sales
The data in this index continues to be revised up to 3 months following initial reporting. The revision usually is not significant enough to change the interpretation of each month's data in real-time. Generally, there are also annual revisions to this data series. The methodology used by the US Census Bureau to seasonally adjust the data is not providing a realistic understanding of the month-to-month movements of the data. One reason is that the US Census uses data over multiple years which includes the largest modern recession which likely distorts the analysis. Further, Econintersect believes there has been a fundamental shift in seasonality in the aftermath of the Great Recession of 2007 - the New Normal. Econintersect determines the month-over-month change by subtracting the current month's year-over-year change from the previous month's year-over-year change. This is the best of the bad options available to determine month-over-month trends - as the preferred methodology would be to use multi-year data (but the New Normal effects and the Great Depression distort historical data). This series is NOT inflation-adjusted -Econintersect uses the PPI - subindex All Manufactured Goods. However, this is a rearview look at the economy. Manufacturing new orders or unfilled orders generally correlates to the economy - but it is not obvious in real-time whether a recession is imminent. So in context to economy watchers - manufacturing by itself cannot be used as an economic gauge.
Adjusted Value - New Orders (blue line) and Unfilled Orders (red line)
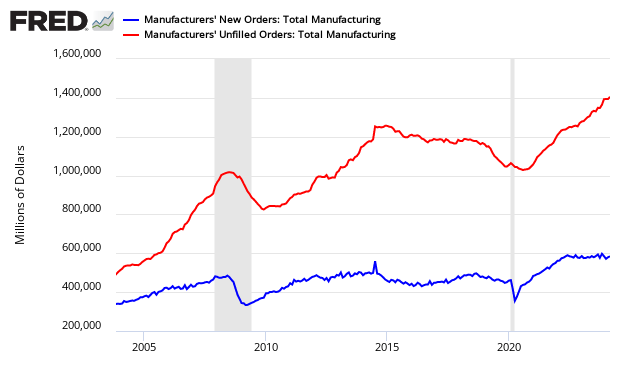
The same issues are also evident if the manufacturing backlog is used as a recession gauge.
Disclaimer: No content is to be construed as investment advise and all content is provided for informational purposes only.The reader is solely responsible for determining whether any investment, ...
more

