
March 2019 CFNAI Super Index Moving Average Continues To Confirm A Slowing Economy
The economy's rate of growth declined based on the Chicago Fed National Activity Index (CFNAI) 3 month moving (3MA) average - and the economy remained below the historical trend rate of growth.

Analyst Opinion of the CFNAI This Month
This index confirms for the last several months - the economy has slowed.
The single month index which is not used for economic forecasting, and unfortunately is what the CFNAI headlines. Economic predictions are based on the 3-month moving average. The single month index historically is very noisy and the 3-month moving average would be the way to view this index in any event.
The previous months' data were revised both up and down with the moving average for last month ending up unchanged.
The three-month moving average of the Chicago Fed National Activity Index (CFNAI) changed from -0.18 (originally reported as -0.18 last month) to -0.24
PLEASE NOTE:
- This index IS NOT accurate in real time (see caveats below) - and it did miss the start of the 2007 recession.
- There were no expectations from Econoday - the actual was -0.15 for the single month index which is not used for economic forecasting.
- This index is a rear view mirror of the economy.
(Click on image to enlarge)

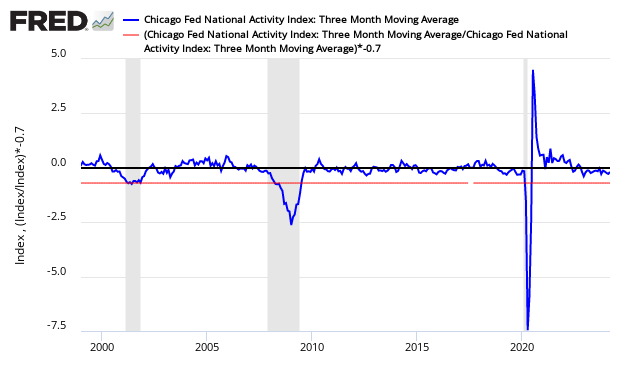
A value of zero for the index would indicate that the national economy is expanding at its historical trend rate of growth and that a level below -0.7 would be indicating a recession was likely underway. Econintersect uses the three-month trend because the index is very noisy (volatile).
CFNAI Three Month Moving Average (blue line) with Historical Recession Line (red line)
(Click on image to enlarge)
As the 3-month index is the trend line, the overall trend for the last few years is upward - but the short term trend is down As stated: this index only begins to show what is happening in the economy after many months of revision following the index's first release.
CFNAI Three Month Moving Average Showing Month-over-Month Change
(Click on image to enlarge)

The CFNAI is a weighted average of 85 indicators drawn from four broad categories of data: 1) production and income; 2) employment, unemployment, and hours; 3) personal consumption and housing, and 4) sales, orders, and inventories.
CFNAI Components - Production and Income (orange line), Employment / Unemployment & Hours (green line), Personal Consumption & Housing (blue line), and Sales / Orders & Inventory (red line)
(Click on image to enlarge)

Low Personal Consumption has been a headwind on the index for the last three years. The other three elements of the CFNAI have taken turns dragging the index down. The Chicago Fed's explanation of the movement this month:
Led by improvements in employment-related indicators, the Chicago Fed National Activity Index (CFNAI) rose to -0.15 in March from -0.31 in February. Three of the four broad categories of indicators that make up the index increased from February, but three of the four categories made negative contributions to the index in March. The index's three-month moving average, CFNAI-MA3, moved down to -0.24 in March from -0.18 in February.
The CFNAI Diffusion Index, which is also a three-month moving average, decreased to -0.18 in March from -0.08 in February. Thirty-seven of the 85 individual indicators made positive contributions to the CFNAI in March, while 47 made negative contributions and one made a neutral contribution. Forty-eight indicators improved from February to March, while 37 indicators deteriorated. Of the indicators that improved, 23 made negative contributions.
The contribution from production-related indicators to the CFNAI ticked up to -0.10 in March from -0.12 in February. Manufacturing industrial production decreased 0.01 percent in March after falling 0.3 percent in February. The sales, orders, and inventories category made a contribution of +0.05 to the CFNAI in March, up slightly from +0.01 in February.
Employment-related indicators contributed -0.03 to the CFNAI in March, up from -0.15 in February. Total nonfarm payrolls rose by 196,000 in March after increasing by 33,000 in the previous month. The contribution of the personal consumption and housing category to the CFNAI ticked down to -0.07 in March from -0.06
in February.The CFNAI was constructed using data available as of April 18, 2019. At that time, March data for 45 of the 85 indicators had been published (fewer than usual because of the partial federal government shutdown).
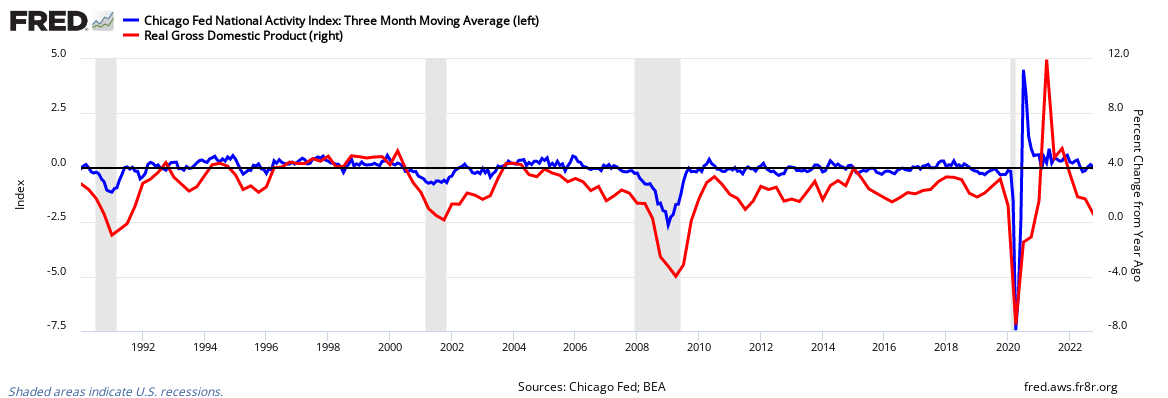
Econintersect considers the CFNAI one of the better single metrics to gauge the real economic activity for the U.S. - and puts the entire month's economic releases into their proper perspective, although it is almost a month after the fact. It correlates well and historically has lead GDP. Note that the CFNAI is updated monthly and within 30 days of period close. GDP is released quarterly so lags the CFNAI by up to three months.
(Click on image to enlarge)
As the CFNAI is a summary index, the data must be assumed correctly to give it credibility. This assumption has been justified in the past because the index has proven to have a good correlation to the overall economy. When using this index, it is trend direction which is important - not necessarily the value when the index is above -0.7, the historical boundary between expansion and contraction.
Caveats on the Use of the Chicago Fed National Activity Index
The index is quite noisy, and the only way to view the data is to use the 3-month moving average. As this index is never set in concrete, each month a good portion (usually from January 2001 onwards) of the data is backwardly revised slightly. The most significant revision is in the data released in the last six months due to revisions of the 85 indices which are embodied into the CFNAI.
Even the 3-month moving average has over time significant backward revision. This is due both to changing methodology and backward revisions of this index's data sources. This point is important as the authors of this index have stated that -0.7 value is the separation between economic expansion and contraction. The graph below shows the difference between the originally published index values and the values of the index as of August 2011.
(Click on image to enlarge)

This index seems to continuously creep - and when using this index in real time, Econintersect would assume the index values when first released could easily be off in a range +0.2 to -0.2 as the data in the future will be continuously revised. However, there are times when the uncertainty in real time can be much larger. For seven consecutive months in the Great Recession, backward revisions ranged from -0.7 to -0.9. In such times of severe economic stress, the CFNAI has little real-time accuracy, although it still definitely was showing that the economy was bad. It simply did not reflect exactly how bad in real time.
We can compare the CFNAI to ECRI's coincident index which is released monthly almost in real time. It is true that using ECRI's coincident index, the year-over-year rate of change is at recession levels - however, the CFNAI's rate of change provides a different conclusion.
(Click on image to enlarge)

In real time, ECRI's coincident indicator may be providing a better yardstick for the Wall Street economy. While in hindsight, CFNAI seems more intuitive - but is inaccurate in real time because of backward revision. GDP lives in its own world (as opposed to what economy is experienced by the population in their own lives) and has a general correlation to most broad forecasts or coincident indexes as a selected view of the overall economy. However, I do not believe GDP has a good correlation to the Main Street economy.
Disclaimer: No content is to be construed as investment advise and all content is provided for informational purposes only.The reader is solely responsible for determining whether any investment, ...
more

