
MACD Above Zero Line: What It Means In 2021
Today we are going to look at which it means to have the macd above zero line.
Can we use it as a reliable indicator for long or short trades?
Moving Average Convergence Divergence is a widely used indicator for analyzing market momentum.
While it also doubles as an oscillator, it is not commonly used to identify overbought and oversold conditions.
Instead, it is used to identify trends.
The indicator uses two moving averages tries to predict the formation of a new trend.
MACD Indicator Description
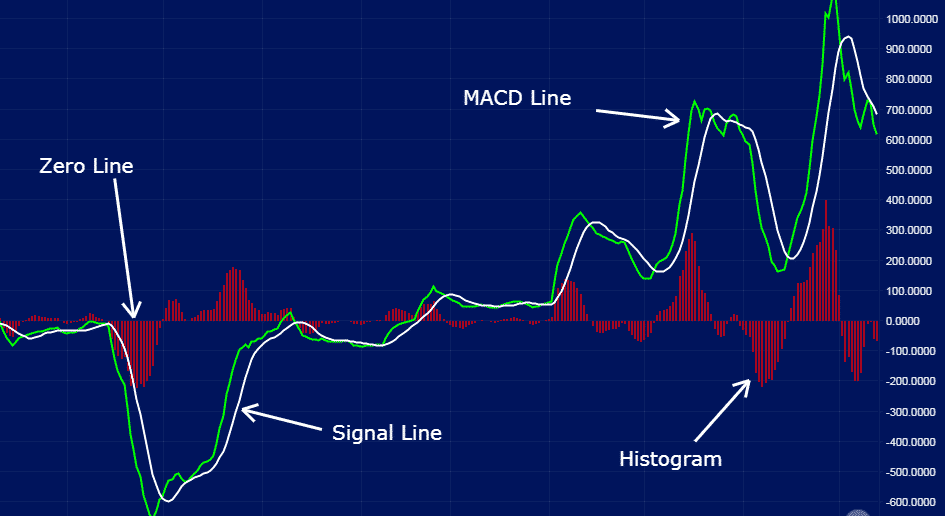
The indicator appears in charts as two lines; the MACD line and the signal line.
There is also a zero line, above which and below which underlying trends emerge.
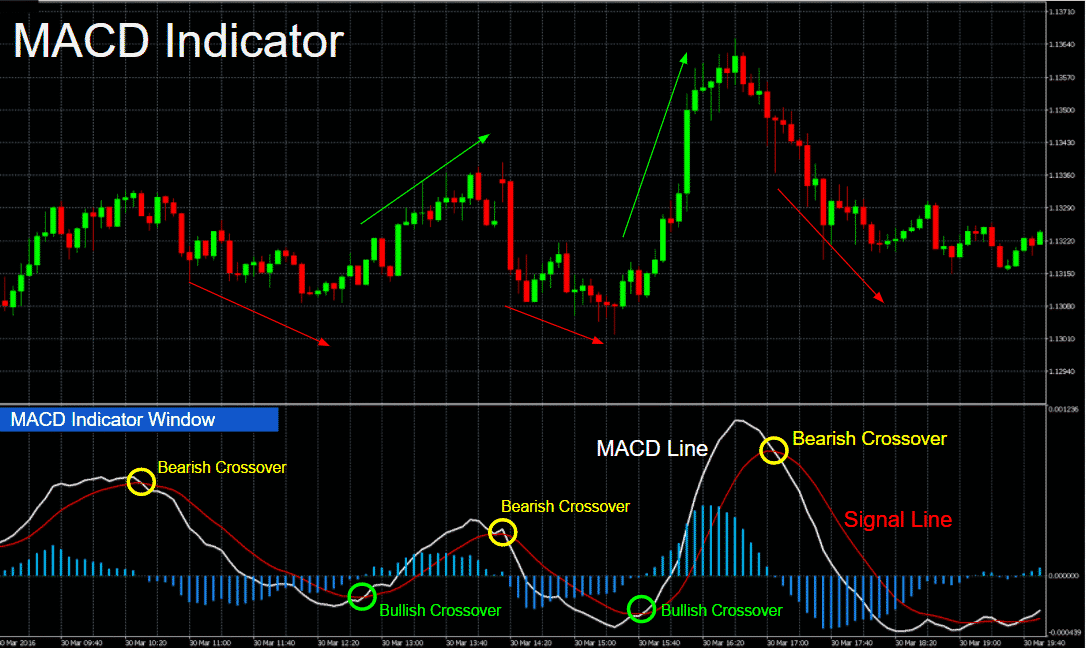
As the two moving average lines cross each other, they give rise to crossover patterns that traders look to profit from.
Source: Blog.liquid.com
The two lines oscillate without boundaries.
The shorter line is usually a 12-period Exponential Moving Average that moves quicker.
The longer one is usually a 26 Exponential Moving Average that moves slower.
Additionally, the MACD indicator comes with a histogram, which indicates the number of bars used to calculate the moving average and the difference between the faster and slower moving averages.
Understanding The MACD Indicator
The MACD line is usually the difference between the two exponential moving averages, 12 and 26.
It also represents the difference between the two lines.
In the MACD indicator, the MACD line is usually the faster-moving average.
On the other hand, the Signal Line is usually the slower moving average.
The Signal line plots the average of the previous MACD line.
In most cases, it is usually the 9-period exponential moving average.
The signal line is used to smooth the sensitivity of the MACD line.
On the other hand, the histogram plots the difference between the MACD line and the Signal line, representing the same in bars.
Depending on how the bars form, they can signal a crossover is about to happen.
Source: Theoptionsguide.com
Whenever the MACD line is above the signal line, the histogram will be above the zero line.
Consequently, whenever the MACD line is below the signal line, the histogram will be below the zero line.
The histogram basically shows market momentum. Whenever the momentum is high, the histogram will be much bigger.
As momentum drops, so will the histogram diminishes in size.
As the distance between the MACD line and Signal line increase, the Histogram becomes bigger leading to divergence as the MACD line is moving away from the signal line,
Similarly, as the moving averages get closer, the histogram becomes smaller, leading to convergence.
It implies the faster moving average is converging and getting closer to the slower moving average
MACD Above Zero Line
The MACD crossing above the zero line, from below, is often considered a bullish signal.
In most cases, it indicates the upward momentum is building up and that price of the underlying security is likely to increase significantly.
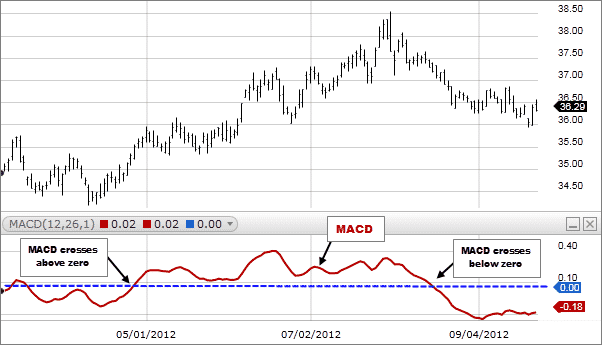
Source: Fidelity.com
The higher the MACD line is from the zero, the stronger the Signal and the likelihood of price moving significantly higher.
In this case, traders will look to enter long positions in anticipation of price appreciation.
Likewise, whenever the MACD line crosses the zero line below, from above, it is interpreted as a bearish signal signaling that the price is likely to fall.
The further away the MACD line is from the zero line in this case, the stronger the bearish Signal.
How To Trade Using The MACD Indicator
The use of two moving averages on the same indicator gives rise to a crossover phenomenon.
The faster-moving average, which in this case is the MACD line, will always react quickly to price movement than the slower one, the signal line.
Similarly, whenever a new trend occurs, the MACD line, which reacts the fastest to price changes, will react faster and cross the slower line, the Signal line.
When this crossover occurs, in either direction, or the MACD line starts to pull away from the signal line, it indicates a new, much stronger trend has formed.
NVDA Example
In the NVDA chart above, a bullish MACD crossover manifests itself with the MACD line crossing the Signal line right near the zero line.
In this case, it signals an uptrend is starting on the fast-moving average responding faster to price changes.
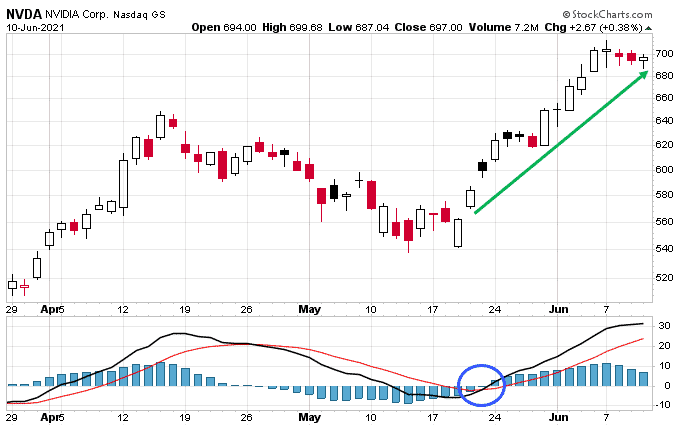
The bullish trend is only confirmed as soon the MACD line rises above the zero line, from below, after crossing the signal line.
Price from this point increased significantly on traders entering long positions.
During periods of heightened market volatility, the MACD line will whipsaw, crossing back and forth the signal line.
MACD users often avoid trading during such periods, given the unreliable signals that come into play.
After the market fully digests the development causing the wild swings, the MACD signal line will cross the signal line and signal the direction price is likely to move.
Likewise, the MACD line crossing the signal line from below and moving above the zero level after heightened volatility would essentially signal the formation of an uptrend.
The MACD line moving further away from the signal line would affirm a stronger signal.
Using MACD Divergence To Find Reversals
Divergence is a powerful indicator when it comes to trend reversals.
The below chart from Fidelity shows the stock making a clear lower low.
At the same time, the MACD indicator is making a higher low.
This indicates that the downtrend is losing strength and may soon reverse.
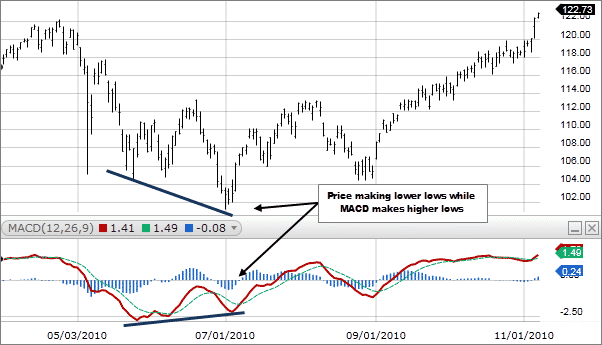
Source: Fidelity.com
Bottom Line
MACD is a reliable trend following momentum indicator commonly used in technical analysis.
The indicator is commonly used to indicate new trends whenever the fast-moving average rises above or below the slow-moving average.
The indicator crossing above the Zero line is considered bullish while crossing below the zero bearish.
Disclaimer: The information above is for educational purposes only and should not be treated as investment advice. The strategy presented would not be suitable for investors who are ...
more

