
MA Option Activity Rising With Retail Spending
MA Unusual Option Activity Report
Bank of America released the details of its card data that shows an uptick in spending following the stimulus, which is good news for payment processors like Mastercard Inc (NYSE: MA). This is why the Federal government loves giving stimulus…people spend it. As spending activity has been rising sharply in recent weeks, so has the option activity in MA. The bulls have been wading into MA for a couple of weeks, but Thursday’s activity was even more pronounced.

Bank of America Card Data
The data shows nearly 10% jump in spending year-over-year for the week ending February 6. In fact, the pace of 2021 spending has nearly doubled from December. There could be a number of factors that is causing this. Stimulus has to be a big one, but also the fact COVID cases are declining and the move toward reopening. Whatever the reason there appears to be some pent-up demand that is coming out, despite being in the middle of a recession.
(Click on image to enlarge)
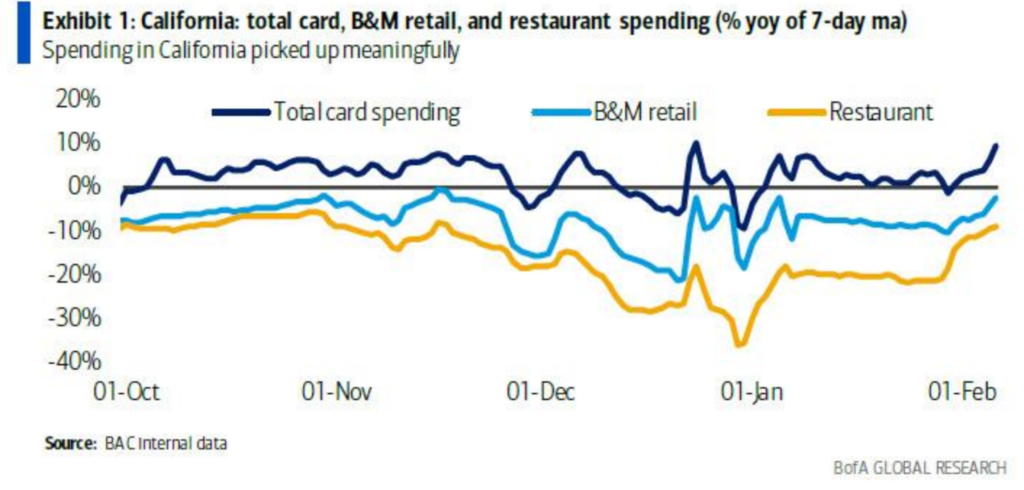
In the image above, you’ll see the recent surge in activity, but also the fact that brick and mortar and restaurants are still behind 2020. However, the slope of the spending curve shows those areas are taking up the slack quickly.
The state that saw the biggest up-tick last week was California, which saw card spending increase 9.5% last week compared to the same week in 2020. With the recall effort picking up steam, it certainly appears that it may be lessening restrictions and increasing spending.
(Click on image to enlarge)

Looking at a breakdown of some of the data for individual states, a trend is established for online spending, assuming more than 50% of spending, furniture, and home improvement. Looking at the price performance of stocks like Mohawk Industries, Inc (NYSE: MHK), Casper Sleep Inc (NYSE: CSPR), Dixie Group Inc (Nasdaq: DXYN), and others certainly reflects this.
MA Option Activity
On Thursday, MA saw a couple of large bullish trades that were made that dovetailed with this Bank of America report. Here is a breakdown of the significant trades that were made yesterday:
- 5,000 19 FEB 21 $350 calls mostly BOT @ $3.50 to $4.45 against open interest of 3,578
- 3,500 18 JUN 21 $350 calls BOT @ $22.30 against open interest of 1,546
- 3,500 18 JUN 21 $390 calls sold @ $8.89 against open interest of 270
The first trade was a long option with a breakeven near $355. The last two entries were part of a long call vertical that reaches max gain with a close above $390 by exploration. A move to that level by June would pace this stock at a new all-time high.
MA Technicals
Since August 11, 2020, the price of MA has remained relatively rangebound. With few exceptions that price has remained within the range of $320 to $355. The price briefly closed above the $355 resistance only to fall back throughout January. Despite selling off a little following their earnings report, the company has rallied since, forming a higher low on February 9.
(Click on image to enlarge)
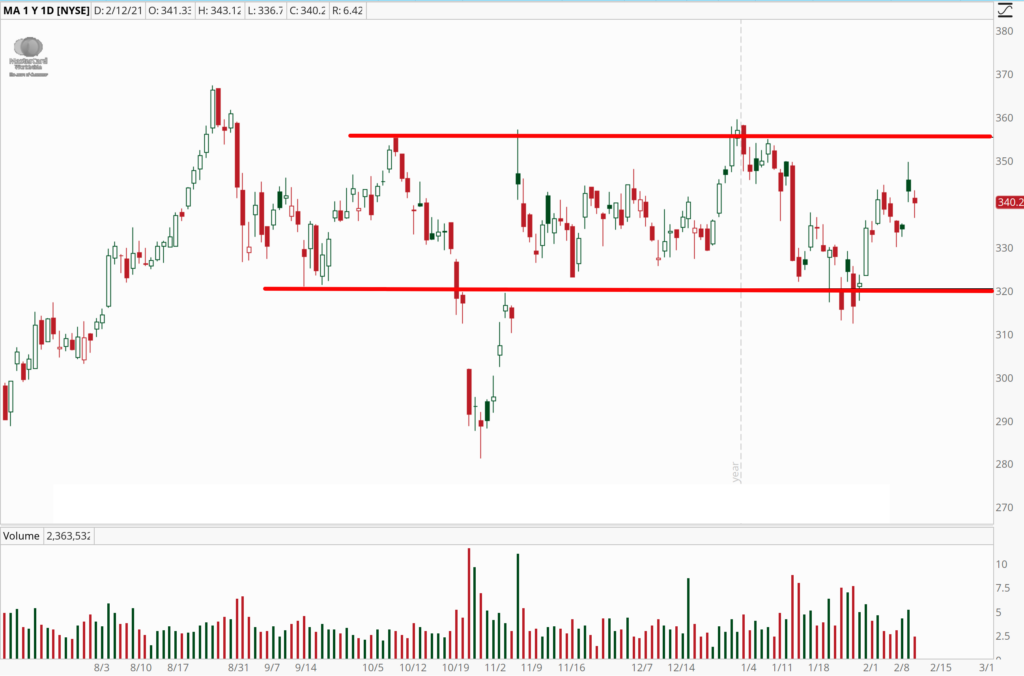
After gapping higher on Thursday, the price traded lower today. However, the price finished off of the lows and closed higher than Thursday’s low. That allowed the price to hold the projected area of support based on Thursday’s low on a gap day.
Conclusion
Looking at the chart and analyzing the option trades, you can see the convergence of the two types of analysis. While the price has been consolidating for many months, the recent spending data and option activity could help be a catalyst for a bullish breakout in the coming weeks.
Disclaimer: Neither TheoTrade or any of its officers, directors, employees, other personnel, representatives, agents or independent contractors is, in such capacities, a licensed financial adviser, ...
more

