
Losses Look Bad But Long Term Investors Should Be Accumulating
Friday was ugly but could have been a whole lot worse. What was particularly worrying was that certain indices were unable to defend either Thursday's close or open and were left set up for another big push lower. However, by the close of business - while not pretty - these indices were certainly better than they could have otherwise been.That's not to say indices can't or won't go lower, but if you are buying low and selling high we are in one of those buying low setups.
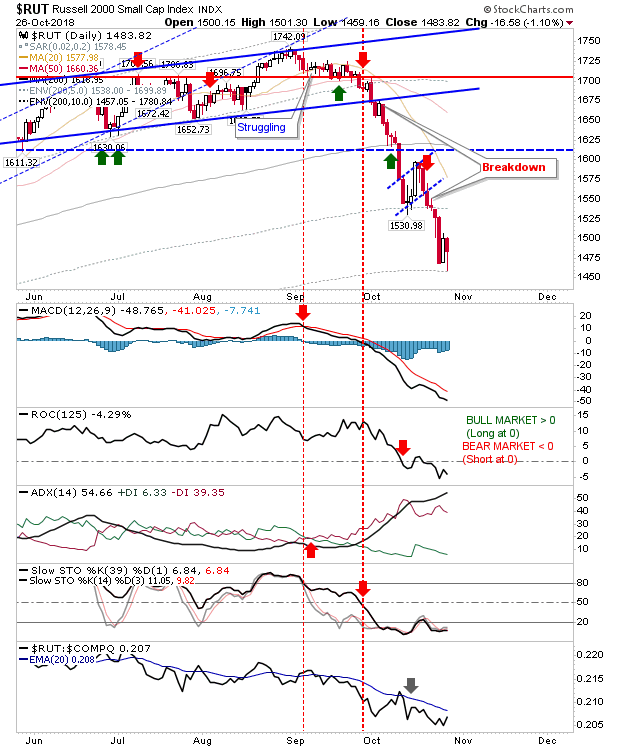
The best index for buyers is the Russell 2000. Friday's action tagged the 10% envelope from its 200-day MA and is an area where 90% of historic action for this index since 1987 has been better than it is now. Should the Russell 2000 tag 1,378 it will reach the 95% zone of historic action. Friday's finish also left it better than halfway inside Thursday's range with a bullish hammer to boot. Relative performance is poor but likely oversold.
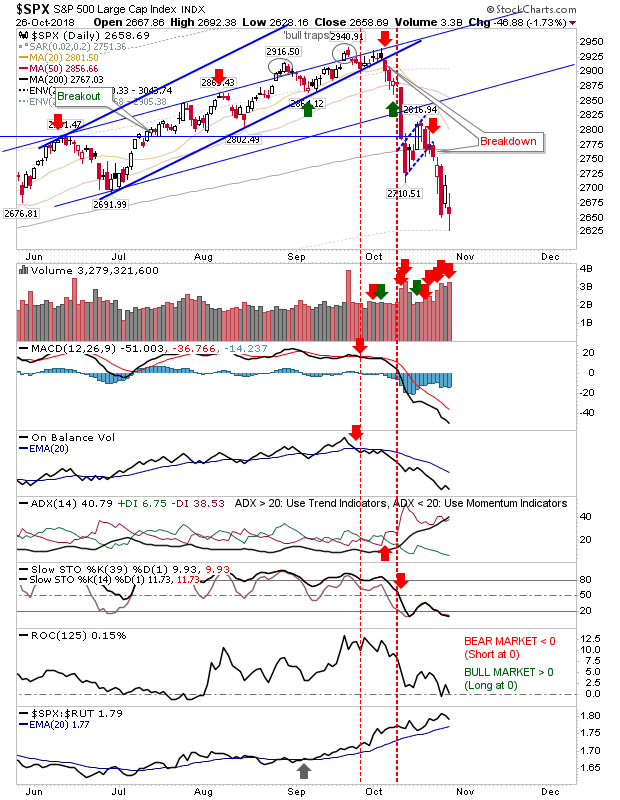
The S&P is in the 85% zone of historic weak action since 1950. It does not offer as a strong a buying opportunity as Friday's finish pointed to in the Russell 2000 but if you want to buy safety then this is the index to watch and buy.Relative performance to other indices is good which points to underlying interest.
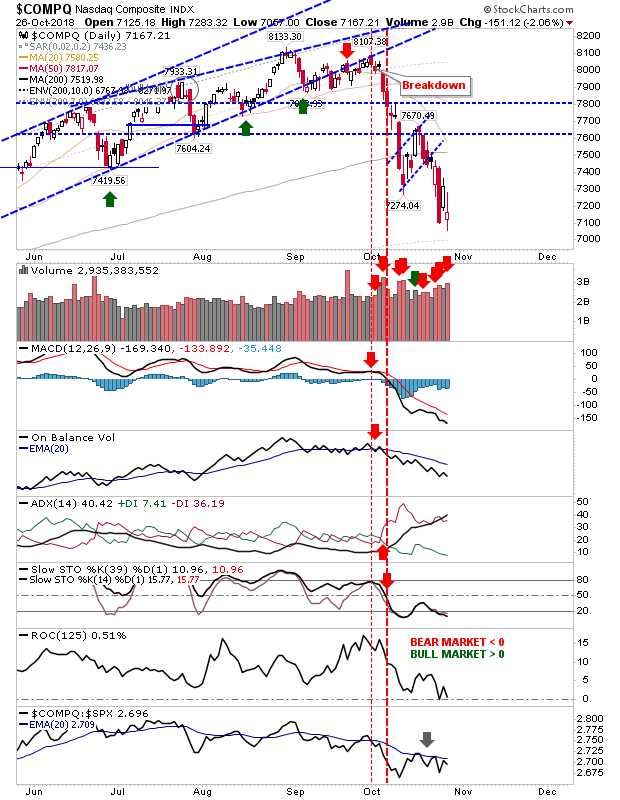
The indices still looking a little rich are the Tech indices. The Nasdaq finished Friday on an indecisive 'spinning top' and there wasn't the same interest from buyers as there was in the Russell 2000. Relative performance to other indices is poor.
The secret sauce for a Tech recovery is the Semiconductor Index. I have not tracked historic action to its 200-day MA but it's looking heavily oversold here. Technicals, while bearish, are shaping bullish divergences.

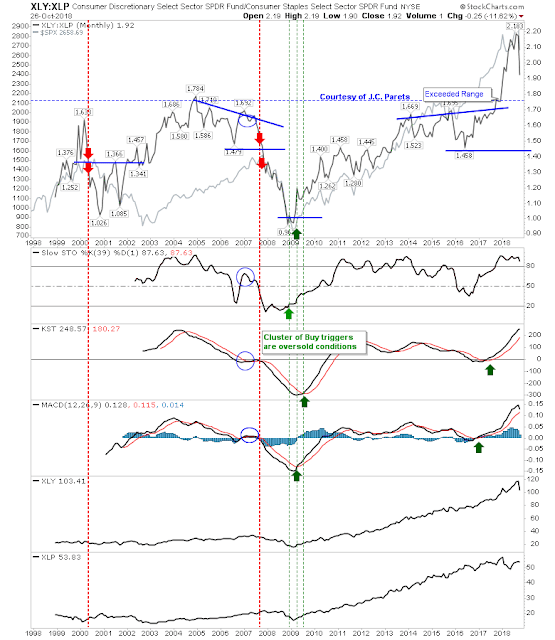
I haven't shown this chart in a while but I'm waiting for a consolidation in the Staples:Discretionary to shape itself out and it's too early to call a top here.
An ugly chart is my Dow Theory one.This relationship has been in decline since 2015, pointing to underlying weakness in the core economy (at least one were physical goods have to be shipped). Last week saw an acceleration in this decline and a new multi-year low. Next key support lurks in the 0.20s and we are a long way from this.

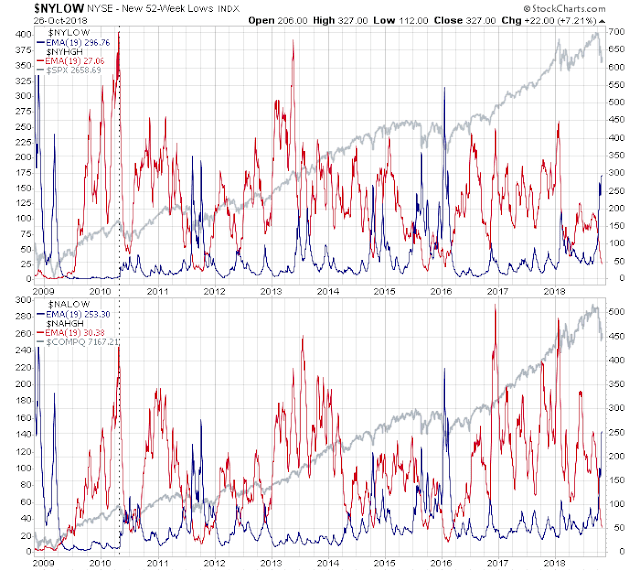
The ratio of new 52-week highs to lows for both the NYSE and Nasdaq suggests a swing low comparable to 2011 and 2016 at a minimum.
This very simple chart of the monthly Nasdaq shows a clear 'sell' signal while the percentage of Nasdaq stocks above 200-day MA is not down at levels typical of a timely buy. Keep watching this chart; when you get to around 15% start backing up the truck.
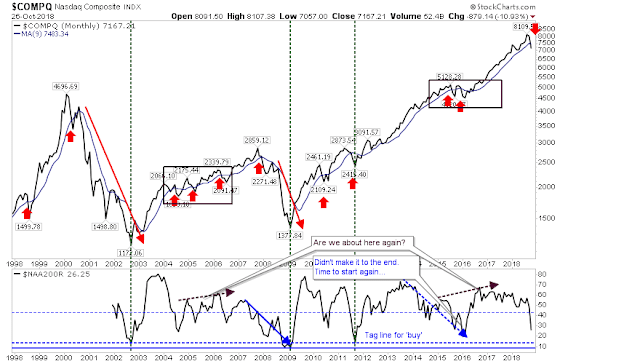
We may still have a way to run until we have the true top. In the last two cases, an inverted yield curve in the 2-year has preceded each market peak. We are still some way (remember, this is a monthly chart) from seeing this happen here.

For next week, long term investors can play for the Russell 2000 (and maybe near term investors too). Shorts need to wait for a bounce to see how it reacts to overhead resistance. Tech traders may want to look to the Semiconductor Index and leave the Nasdaq and Nasdaq 100 for another day.


Excellent analysis.