
Looking Into 2019
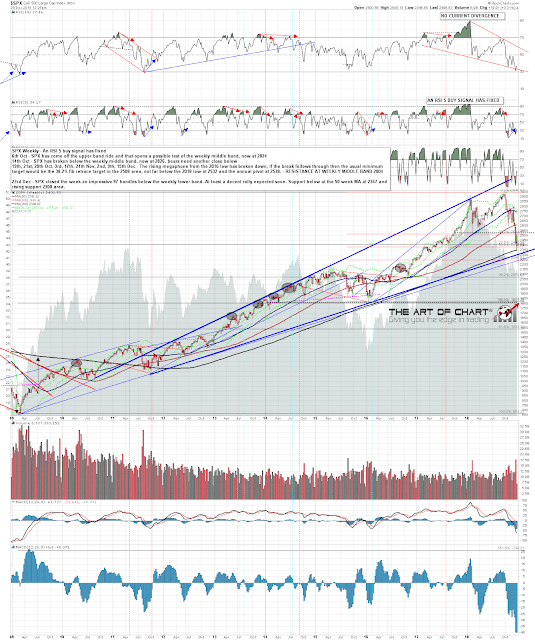
Over the weekend I was talking about the 2300-50 support area on SPX, and the current rally has started from there. That area is composed of the monthly lower band and the 200 week MA, both in the 2350 area, the 50 month MA at 2330, and rising megaphone support from the 2011 low now in the 2300 area. That is a formidable support area and, if broken, could open a direct move to the double top target area 2120-2200. If it holds that would be the obvious area to end the wave A move down from the high and start the wave B rally. If we see a retest of the lows after this rally ends then that could well be a double bottom setting up for the wave B rally. SPX weekly chart:
In the short term, declining resistance from 2800 has been broken and SPX is consolidating above the 50 hour MA, currently at 2472. Obvious resistance above is at broken double top support at 2532, the annual pivot (until Monday close) at 2538, and the maximum level I am thinking this rally could reach, the daily middle band now at 2589 and declining at about ten handles per day. There is still an open hourly RSI 14 buy signal that is favoring at least somewhat higher. SPX 60min chart:
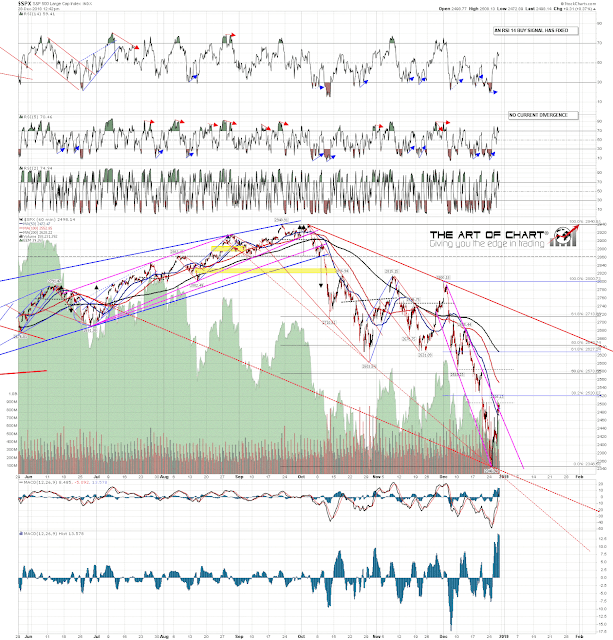
The short term pattern is unclear as yet but rising (likely bear flag) support is now in the 2415-20 area, with closer support at the 50 hour MA now at 2472. The 5dma is currently at 2444 and this is day three on the Three Day Rule, so a close below there today would be very bearish, but doesn’t seem that likely at the moment. SPX 15min chart:


