
Kura Oncology - All Time High
Even on a day when the market seems to trend against you can always find a few undiscovered gems if you look hard enough.
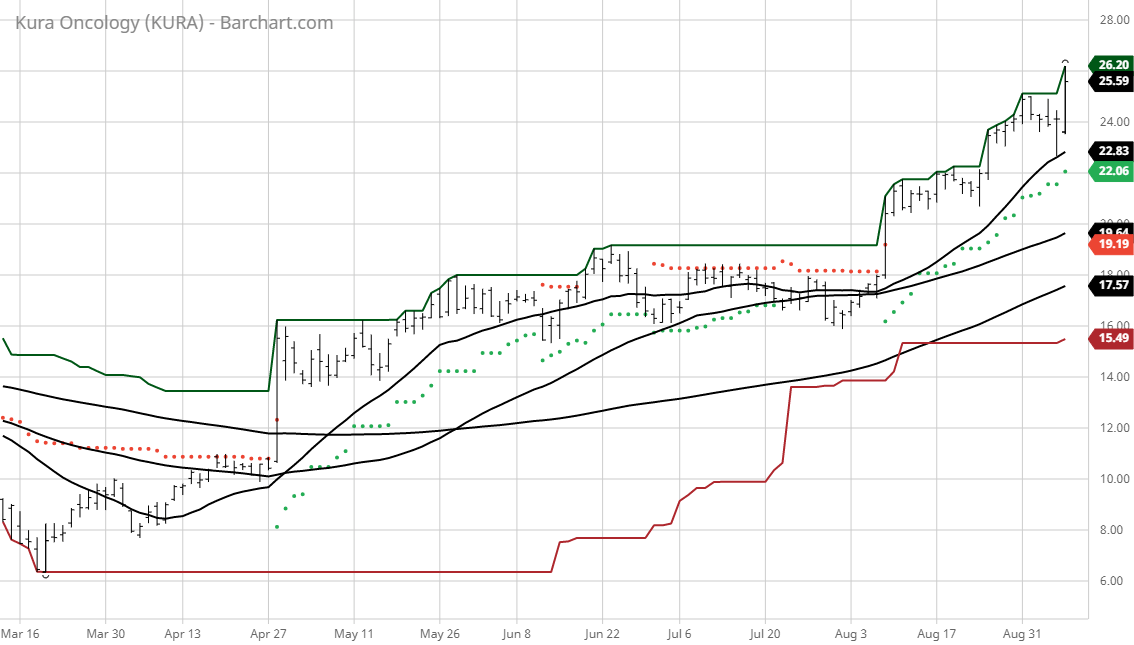
The Barchart Chart of the Day belongs to the biomedical company Kura Oncology (Nasdaq:KURA). I found the stock by sorting Barchart's New All-Time High list first by the most frequent number of new highs in the last month, then used the Flipchart feature t review the charts for consistent price appreciation. Since the Trend Spotter signaled a buy on 8/10 the stock gained 20.20%.
Kura Oncology, Inc., a clinical-stage biopharmaceutical company, develops medicines for the treatment of cancer. Its pipeline consists of small molecule product candidates that target cancer. The company's lead product candidate is Tipifarnib, an orally bioavailable inhibitor of farnesyl transferase that is in Phase II clinical trials for the treatment of solid tumors, peripheral T-cell lymphomas, and other hematologic malignancies. It is also developing KO-947, a small molecule inhibitor of extracellular signal related kinase used for the treatment of patients with tumors that have dysregulated activity due to mutations or other mechanisms in the mitogen-activated protein kinase pathway; and KO-539, a small molecule inhibitor of the menin-mixed lineage leukemia protein-protein interaction. Kura Oncology, Inc. was founded in 2014 and is headquartered in San Diego, California.
Barchart's Opinion Trading systems are listed below. Please note that the Barchart Opinion indicators are updated live during the session every 10 minutes and can therefore change during the day as the market fluctuates. The indicator numbers shown below therefore may not match what you see live on the Barchart.com website when you read this report.
Barchart technical indicators:
- 100% technical buy signals
- 69.02+ Weighted Alpha
- 64.91% gain in the last year
- Trend Spotter buy signal
- Above its 20, 50 and 100 day moving averages
- 10 new highs and up 25.48% in the last month
- Relative strength index 75.69%
- Technical support level at 23.04
- Recently traded at 25.59 with a 50 day moving average of 19.64
Fundamental factors:
- Market Cap $1.36 billion
- Not highly followed but analysts estimate earnings will grow at an annual compounded rate of 19.93% for the next 5 years
- The individual investors following the stock on Motley Fool voted 15 to 0 that the stock will beat the market
- 2,960 investors are monitoring the stock on Seeking Alpha
Disclosure: None.


