
June 2019 Import Price Year-Over-Year Inflation Declines To -2.0%
Year-over-year import and export prices declined.

Analyst Opinion of the Import / Export Price Situation
Import and export pricing declined and is now the lowest in the last 12 months.
Import Oil prices were down -6.5 % month-over-month, and export agricultural prices were up 2.7 %.
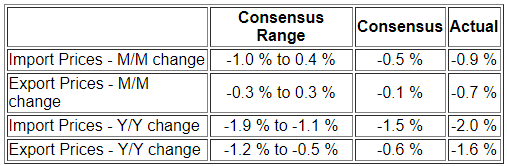
- the markets were expecting (from Econoday):
(Click on image to enlarge)
There is only a marginal correlation between economic activity, recessions, and export/import prices. Prices can be rising or falling going into a recession or entering a period of expansion. Econintersect follows this data series to adjust economic activity for the effects of inflation where there are clear relationships.
Econintersect follows this series to adjust data for inflation.
Year-over-Year Change - Import Prices (blue line) and Export Prices (red line)
(Click on image to enlarge)

There are three cases of deflation outside of a recession - early 1990′s, late 1990′s, and mid 2000′s. Import price deflation is normally associated with the strengthening of the dollar relative to other currencies.
According to the press release:
All Imports: Prices for U.S. imports declined 0.9 percent in June, the first monthly decrease since the index fell 1.4 percent in December 2018. Import prices decreased 2.0 percent over the past 12 months, the largest overthe-year drop since the index fell 2.2 percent from August 2015 to August 2016.
All Exports: U.S. export prices fell 0.7 percent in June, after decreasing 0.2 percent in May. The June decline was the largest monthly drop for the index since a 0.8-percent decrease in November 2018. The price index for overall exports fell 1.6 percent for the year ended in June, the largest 12-month decline since the index decreased 2.4 percent from August 2015 to August 2016.
Month-over-Month Change - Import Prices (blue line) and Export Prices (red line)
(Click on image to enlarge)

The biggest mover of import and export prices are usually oil (imports) and agricultural products (exports).
Oil Import Price Change Month-over-Month (blue line) and Agriculture Export Change Month-over-Month (red line)
(Click on image to enlarge)

Caveats on the Use of the Export / Import Price Index
Both import and export prices index values shown in this post is a weighted average for the entire category of exports or imports. The BLS has many sub-categories relating to a particular commodity or goods. Econintersect using spot checks believes these subindexes are accurate.
Disclaimer: No content is to be construed as investment advise and all content is provided for informational purposes only.The reader is solely responsible for determining whether any investment, ...
more

