
Jul 8 Above The 40 – Bears Overstay Their Welcome
AT40 = 60.5% of stocks are trading above their respective 40-day moving averages (DMAs)
AT200 = 56.8% of stocks are trading above their respective 200DMAs
VIX = 13.4
Short-term Trading Call: neutral
Commentary
Until Friday’s 0.8% gain on the S&P 500 (SPY) in the wake of another strong jobs report, I was still expecting the bearish case for the market’s technicals to reassert themselves. Instead, bears lost control of the 50DMA pivoting action, and buyers pushed the index right through a now declining 20-day moving average (DMA).
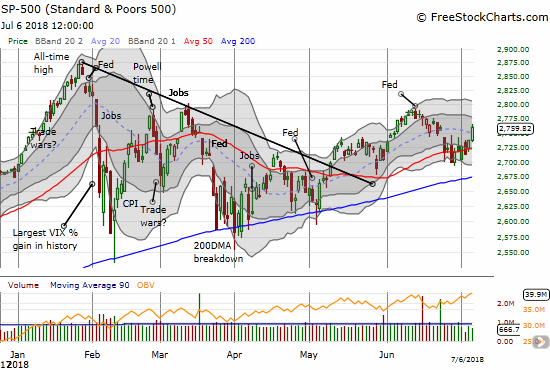
The S&P 500 (SPY) broke away from its 50DMA pivot in a move that positions the index for a fresh upward push.
With the S&P 500 effectively breaking out, I backed off my bearish short-term trading call and flipped to neutral. AT40 (T2108), the percentage of stocks trading above their respective 40DMAs, is adding to an apparent change in momentum with gains 4 straight days. The first day’s gain was marginal, but it came after my favorite technical inidicator gapped down to start last week’s trading. That gap down at first appeared to deliver further confirmation of the market’s bearish burden. AT200 (T2107), the percentage of stocks trading above their respective 200DMAs, added to the case of the bulls by soaring last week from a low of 48.4% to a close of 56.8%. This longer-term indicator is now less than two percentage points away from June’s peak.
The volatility index, the VIX, all but nailed the coffin on the bearish case. After looking like it would hold the 15.35 pivot line, the VIX freshly collapsed on Friday. The fear gauge dropped 10.7% and closed at 13.4. I still think the 12 level will hold as support. Some fresh tensions could build in the market as complacency presses for that support level at the same time AT40 reaches for the overbought level of 70%.
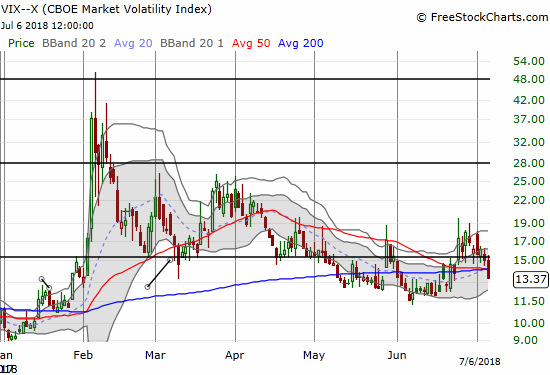
The volatility index, the VIX, has apparently come to the end of another (short) fear cycle.
Other indices are looking as bullish as ever. The NASDAQ gained 1.3% on Friday and confirmed a successful test of 50DMA support. The Invesco QQQ Trust (QQQ) gained 1.6% in a move that also confirmed 50DMA support. The iShares Russell 2000 ETF (IWM) bounced off 50DMA support after gapping down to start last week’s trading. Buyers steamrolled their way higher from there.
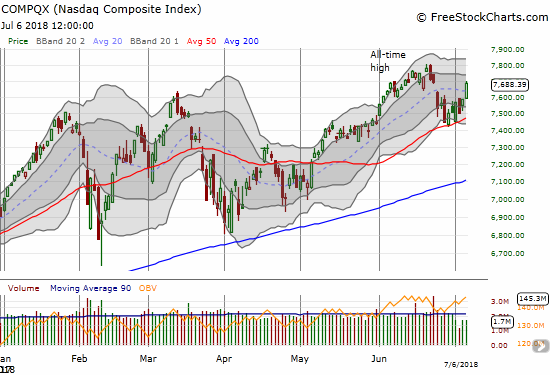
The NASDAQ created a bit of suspense over the test of its 50DMA support. Friday’s big breakout confirmed that support and put another all-time high into play.
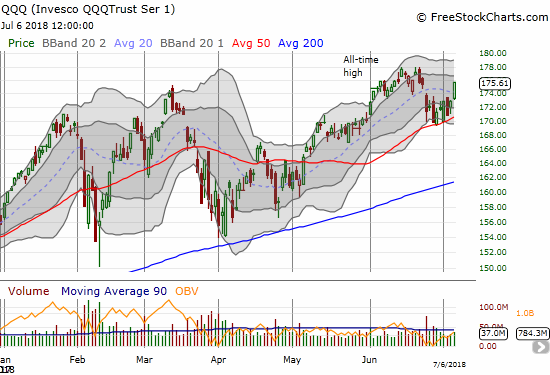
The Invesco QQQ Trust (QQQ) is stretching for its all-time high after slicing right through its 20DMa and confirming 50DMA support.
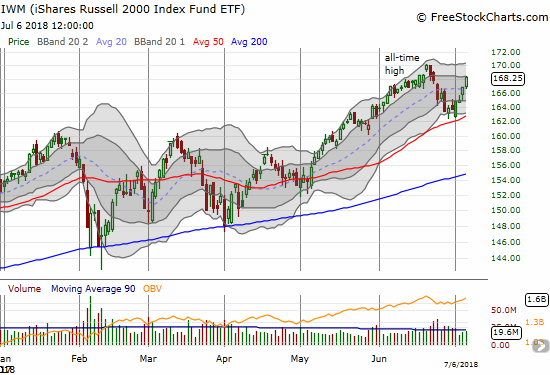
The iShares Russell 2000 ETF (IWM) is sprinting higher off a successful test of 50DMA support. A new all-time high is easily within view.
The test of 50DMA support levels played out in slow motion. The dynamics kept me sitting on my short-term bearish call one day too long. I also became increasingly confident in my call given earlier successes with bearish bets. While I remain extremely skeptical of the stock market, I am respecting the successful test of a key support level. I do not want to overstay my welcome in the bearish camp yet another day. I ended this bearish cycle by buying fresh call options on ProShares Ultra VIX Short-Term Futures (UVXY) and doubling down on QQQ put options.
My abiding market skepticism means that if (when?) AT40 shoves its way back into overbought territory, I am NOT going to flip my short-term trading call back to bullish. Instead, I will stay neutral and wait for the next fall from overbought territory to get back to my new comfort zone in the bearish camp. A fresh breakdown below 50DMA support will of course be a freshly bearish event.
CHART REVIEWS
Apple (AAPL)
In my last AT40 post, I designated AAPL as a likely early indicator for ending my short-term bearish call. It turned out to be much more a follower than a leader. On Thursday, the NASDAQ recovered its entire loss from pre-holiday (U.S. Independence Day) trading. AAPL only gapped up slightly and barely hung out near its 50DMA support. Even on Friday, AAPL barely broke out above the recent churn. I will not be surprised if AAPL falls right back to 50DMA support at some point this week. Note that I failed to get a fill for my weekly call option trade, so I will likely be a buyer on the next AAPL dip.
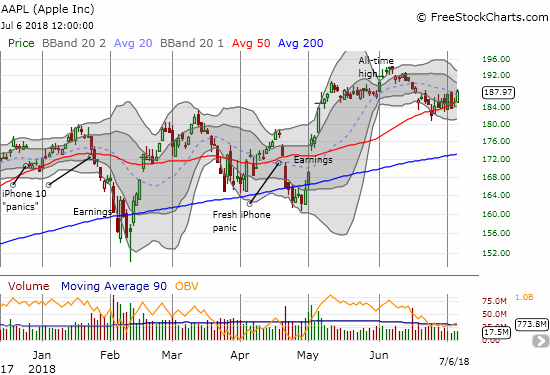
Apple (AAPL) is slowly and somewhat reluctantly following its uptrending 50DMA support higher.
Axovant Sciences (AXON)
AXON seemed to achieve a near perfect test of 50DMA support last week. I bought back in just in time for that test. Yet with the stock closing in on $3 and up almost 25% in just two more days, I decided to take profits again. I am on the hunt for another entry point now.
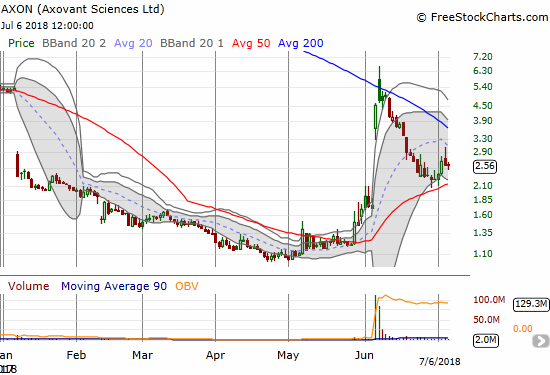
Axovant Sciences (AXON) confirmed support at its 50DMA but faltered again at $3/share
Acuity Brands (AYI)
AYI has suffered mightily since peaking almost two years ago. When the stock gapped up over its downward trending 50DMA for a gain as high as 19%, I was tempted to believe AYI finally found bottom. Yet, the stock was trading at extremely high levels soaring well above its upper-BB. I did not think those levels could hold in what was then still a bearish market trading environment; so I decided to fade the stock. My put option doubled the same day, and I took profits. With my short-term trading call at neutral, AYI now looks like a nice buy with a tight stop at a new post-earnings low where the lower bound of the BB channel provided support.
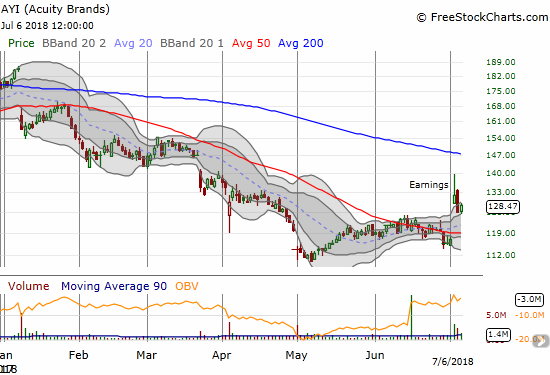
Acuity Brands (AYI) soared well above its upper Bollinger Band (BB) before fading hard. Sellers took over and took stock back to the lower boundary of the BB band before the stock bounced again.
BHP Billiton (BHP) and Rio Tinto (RIO)
I did not take profits on my latest tranche of BHP put options, and I may end up regretting it again. I decided instead to buy a call option on RIO as a hedge. Now I have a different kind of pairs trade from my original strategy of waiting for RIO to breakout before buying calls on the stock. Both BHP and RIO rallied on Friday despite a surprisingly bearish report on future iron prices in the latest Resources and Energy report from Australia’s Department of Industry. Moreover, iron ore prices are sinkingunder the weight of a slowing Chinese economy and a growing trade war between the U.S. and China.
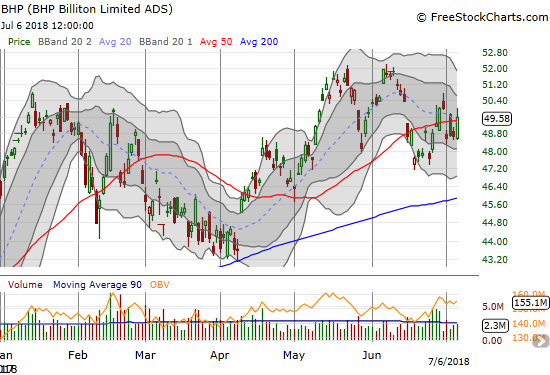
BHP Billiton (BHP) is starting to pivot around its 50DMA.
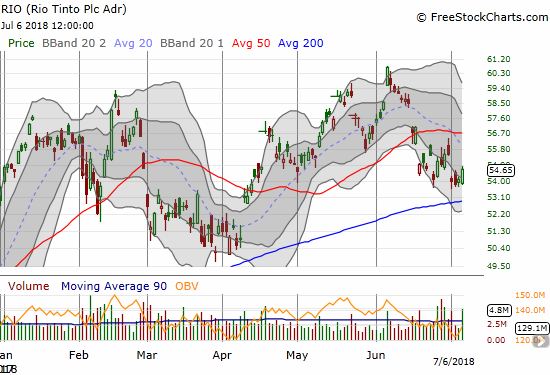
Rio Tinto (RIO) is barely avoiding a retest of 200DMA support.
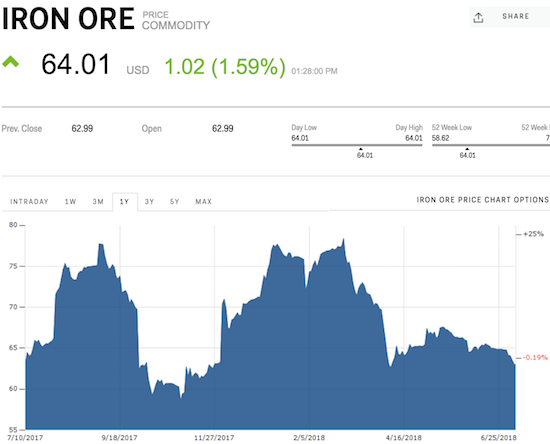
The price of iron ore is slowly grinding lower, almost like it is holding out for a positive catalyst to save it from new lows.
Source of iron ore chart: Business Insider
Caterpillar (CAT)
CAT failed to join the market’s breakout. I fully expect the stock to break down on the next bout of general market weakness. CAT is once again a good hedge on bullishness, and I have the long side of a calendar put spread going into this week.
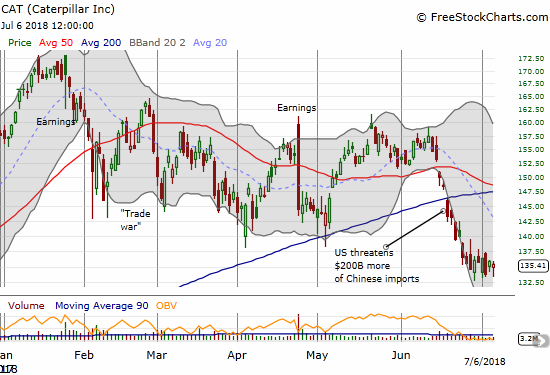
Caterpillar is churning at its 9-month low (which coincides with the gap up from October earnings).
Dropbox (DBX)
I was hesitant to buy into DBX given I fail to understand how the company makes enough money to sustain its business model. Still, since that day of reckoning may yet be a ways away, I decided to buy into DBX clinging onto 50DMA support. DBX has experienced a WILD three weeks!
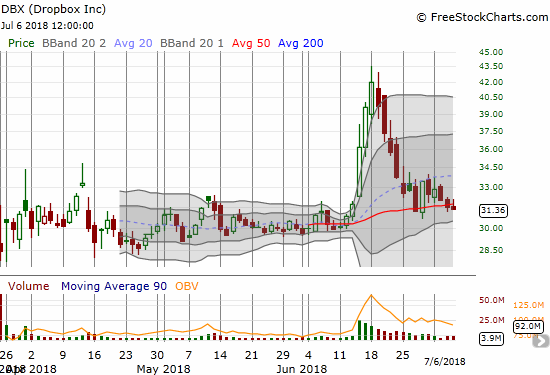
Dropbox (DBX) was one of many recent IPOs that found strong support from speculators in the first half of June. Sellers wiped out the entire breakout, and now the stock is struggling to hold to 50DMA support.
iShares Nasdaq Biotechnology ETF (IBB)
Speculation must be back in vogue when IBB is soaring. Friday’s breakout to a 3.8% gain put IBB within shouting distance of its 2018 high. IBB could have provided my early indicator to back off my bearish stance, particularly after the impressive bounce off 50/200 DMA support levels.
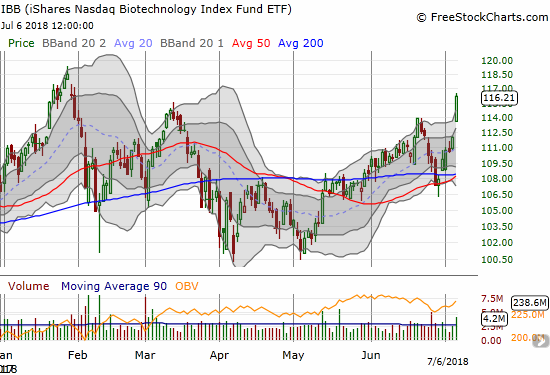
The iShares Nasdaq Biotechnology ETF (IBB) came alive last week with a 5.8% gain that confirmed 50DMA support.
Intel (INTC)
INTC is quietly trying to recover from the post-CEO fallout. I am surprised it did not test 200DMa support before making a run for higher prices. I suspect a 200DMA test is still in INTC’s future, so I did not buy into this latest dip. I will just wait until July’s earnings report to decide on the next between earnings play.
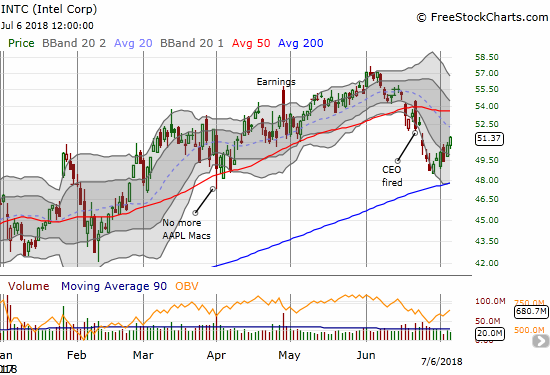
Intel (INTC) is steadily recovering from the fallout from the firing of the company’s CEO.
Tesla (TSLA)
TSLA is actually fading hard after reporting news. The latest production report sent the stock higher at first before sellers completely overwhelmed the stock. I speculated on the 200DMA holding with a calendar call spread. With TSLA moving on to crater through 50DMA support, the long side of this options play is in a very precarious position with expiration coming up this Friday.
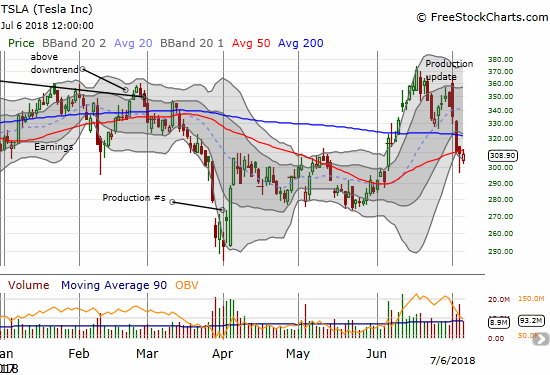
Tesla (TSLA) sliced right through 200DMA support and then slipped over the edge of 50DMA support. With trading volume soaring are sellers finally gaining the upper hand?
Walgreens Boots Alliance (WBA)
WBA is making an impressive post-Amazon panic bounce. I did not want to buy into this panic because I believe the Amazon.com (AMZN) threat to pharmacies is very real. It is truly amazing how consistently stocks pull off bounces from Amazon panics.
I am now looking to short WBA given the fade from 50DMA resistance.
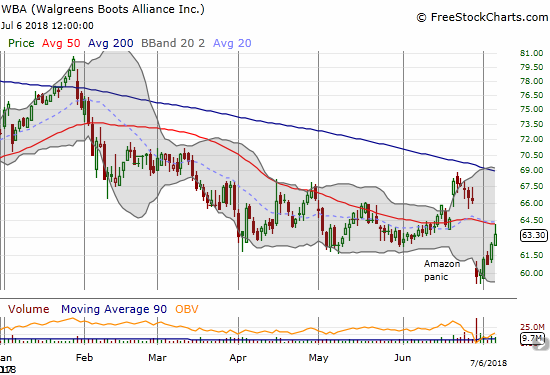
Walgreens Boots Alliance (WBA) is making a rapid recovery from the latest Amazon panic. Still, the stock closed the week with a picture-perfect fade from 50DMA resistance.
— – —
“Above the 40” uses the percentage of stocks trading above their respective 40-day moving averages (DMAs) to assess the technical health of the stock market and to identify extremes in market sentiment that are likely to reverse. Abbreviated as AT40, Above the 40 is an alternative label for “T2108” which was created by Worden. Learn more about T2108 on my T2108 Resource Page. AT200, or T2107, measures the percentage of stocks trading above their respective 200DMAs.
Active AT40 (T2108) periods: Day #96 over 20%, Day #65 over 30%, Day #60 over 40%, Day #3 over 50%, Day #1 over 60% (overperiod ending 7 days under 60%), Day #16 under 70%
Daily AT40 (T2108)

Black line: AT40 (T2108) (% measured on the right)
Red line: Overbought threshold (70%); Blue line: Oversold threshold (20%)
Weekly AT40 (T2108)

*
All charts created using freestockcharts.com unless otherwise stated
The charts above are my LATEST updates independent of the date of this given AT40 post. For my latest AT40 post click here.
Be careful out there!
Full disclosure: long QQQ puts, long BHP puts, long RIO call, long CAT put, long DBX, long TSLA call
*Charting notes: FreeStockCharts.com stock prices are not adjusted for dividends. ...
more

