
Job Openings Outpace Hiring Growth
March job openings surpassed estimates considerably as they increased from 7.142 million to 7.488 million. The consensus was for 7.215 million and the high end of the estimate range was 7.24 million. Yearly openings growth was 8.6%. While that seems fantastic, hiring growth was only 0.6% which means either businesses aren’t serious about filling job openings or there isn’t enough skilled talent to meet demand. The gap between openings and hiring increased to a record 1.828 million as there were 5.66 million hires.
With the decline in weekly average earnings growth in April, in many industries, it’s much easier to acquire talent if employers raise wages. Before claiming there is a shortage of workers, recognize that every type of worker can be acquired for the right price and that labor dynamics differ vastly based on location and industry. The charts below show the job openings rate in various industries.
job openings rate pic.twitter.com/qcXVQ6VDuE
— Leonard Kiefer (@lenkiefer) May 7, 2019
Construction stands out as a huge winner despite the weakness in the residential real estate market. Its job openings were up 54% yearly. Real estate, rental, and leasing job openings were up 39%. Information openings were up 30%.
The good news is the gap between openings and the number of unemployed people actively looking for work increased to 1.277 million as there are 6.211 million people looking for a job. There are 0.83 unemployed workers per job opening. Economic growth could be limited by the labor supply if this is an accurate depiction of the labor market.
A negative signal for the labor market is quits fell from 3.447 million to 3.409 million. If the labor market is strong, people quit their jobs to find a new better paying one. The quits rate has been at 2.3% for 10 months straight. That’s relatively high, which is a good thing. It’s the highest reading ever was 2.5%. This survey was started in December 2000.
Weak Non-Manufacturing ISM PMI
The weak ISM manufacturing PMI was paired with a weak non-manufacturing PMI in April. As you can see from the chart below, the PMI fell from 56.1 to 55.5 making it the lowest reading since July 2017.
(Click on image to enlarge)
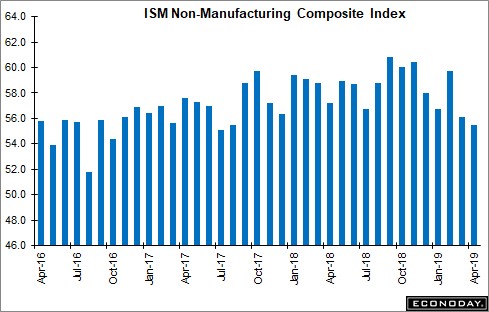
This reading was below estimates for 57.3 and the 12 month average of 58.4. It’s consistent with GDP growth of 2.4% which is slightly above most estimates. The CNBC median calculation of Q2 GDP growth estimates is 2%.
Even though the PMI fell, business activity/production increased 2.1 points to 59.5. The new orders index fell 0.9 to 58.1. Employment fell 2.2 points to 53.7. Just like the manufacturing prices index, the non-manufacturing prices index fell. It was down 3 points to 55.7. Even still, April headline CPI is expected to increase from 1.9% to 2.1% and core inflation is expected to increase from 2% to 2.1%. That report comes out this Friday.
The quotes in this report include a comment on the housing market which has been weak for over one year. A construction firm stated, “Spring selling season is here for residential construction. Sales are coming, but negotiations are now the norm. Traffic is higher than the last three months, mostly due to lower mortgage rates.” This is interesting because the April Housing Market index showed traffic falling. The reading was 47; 50 is the flatline. If house price growth continues to fall, it will become an additional catalyst to housing demand. MBA purchase applications growth isn’t as optimistic as this construction firm. Growth was strong in March but waned in April as the reading from the last week of April had yearly growth of just 1%. At least growth in the first week of May increased to 5%.
Markit Service PMI Also Falls
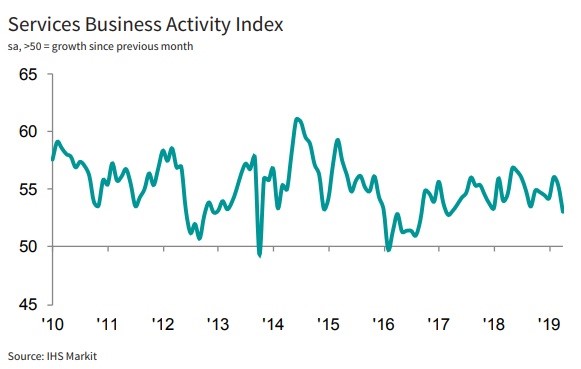
As you can see in the chart below, the Markit service PMI also fell in April. It declined from 55.3 to 53. Business activity growth was the slowest since March 2017. Job creation growth was the lowest in 2 years. Input and output inflation fell to the lowest rate in 26 and 18 months. Business optimism was the lowest since the mid-2016. Markit stated this reading is consistent with 1.9% GDP growth which is basically in line with the median of estimates. Unlike the American reading, China’s services PMI increased from 54.4 to 54.5 as the economy is being helped by its fiscal stimulus.
(Click on image to enlarge)
Consumer Credit
Even though the savings rate fell from 7.3% to 6.5%, credit card debt actually fell in March, signaling the consumer isn’t taking too much risk. Overall, consumer credit growth was $10.3 billion which was down from $15.5 billion in February. It missed estimates for $16.5 billion and the low end of the consensus range which was $14.0 billion.
As you can see from the chart below, revolving credit fell $2.2 billion in March and rose $3.1 billion in February.
(Click on image to enlarge)
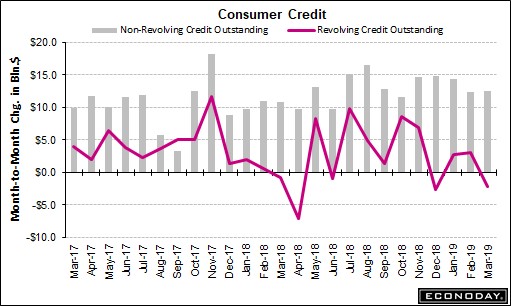
Non-revolving debt, which is student loans and auto loans, increased $12.5 billion which was $100 million more than February’s increase. Quarterly credit growth in Q1 fell from 5.5% to 4.3%. Credit card debt growth fell from 5% to 1.4%. Non-revolving debt growth increased from 5.3% to 5.6%.
Trade Not Ideal
As you can see from the chart below, trade volumes have fallen 2 straight quarters for the first time since the 2008-2009 global recession. That’s not the ideal scenario to be in with America and China ratcheting up their trade war as America could potentially raise its tariffs on $200 billion of Chinese goods from 10% to 25%.
Global trade volumes have contracted for two consequtive quarters, the first time since the 2008-9 global recession
— Babak (@TN) May 2, 2019
chart via NBF Economics pic.twitter.com/KQMsSHWsHm
According to a UBS strategist, a full-blown trade war could take 45 basis points off global growth which would be enough to push the global economy into a recession.
Conclusion
Job openings were strong in March, but hiring growth was weak. The non-manufacturing ISM PMI was the weakest since July 2017. The Markit services report stated business optimism was the weakest since mid-2016. In March, consumer credit card debt actually fell. Its growth rate fell from 5% to only 1.4% in Q1. The consumer isn’t leveraging up. The trade war with China will only hurt trade growth which is already down 2 straight quarters for mostly cyclical reasons.
Disclaimer: Please familiarize yourself with our full disclaimer here.


