
January 2021 Import Year-Over-Year Inflation Now +0.9%
Year-over-year import price indices inflation remained in contraction and grew from -0.3 % to +0.9 %.

Analyst Opinion of the Import / Export Price Situation
Per the BLS:
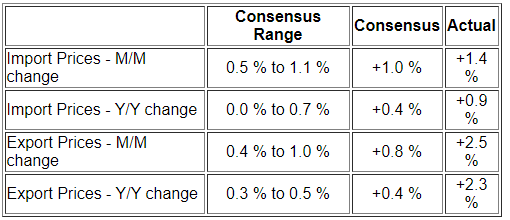
Prices for U.S. imports increased 1.4 percent in January, after rising 1.0 percent in December, the U.S. Bureau of Labor Statistics reported today. The January advance was the largest 1-month rise since the index increased 1.4 percent in March 2012. U.S. export prices increased 2.5 percent in January following advances of 1.3 percent and 0.7 percent the 2 previous months. The January increase was the largest advance since the index was first published on a monthly basis in December 1988.
Note that:
Coronavirus (COVID-19) Pandemic Impact on January 2021 Import and Export Price Index Data The Bureau of Labor Statistics did not make changes to either the collection method or estimation methodology for the January 2021 release of U.S. Import and Export Price Indexes. Survey response rates for January were 5.9-percentage points lower than those in January 2020.
Import Oil prices moved from a revised +8.1 % to +7.4 % month-over-month, and export agricultural prices up from +0.9 % to +0.6 %
- the markets were expecting (from Econoday):
(Click on image to enlarge)
There is only a marginal correlation between economic activity, recessions, and export/import prices. Prices can be rising or falling going into a recession or entering a period of expansion. Econintersect follows this data series to adjust economic activity for the effects of inflation where there are clear relationships.
Econintersect follows this series to adjust data for inflation.
Year-over-Year Change - Import Prices (blue line) and Export Prices (red line)
(Click on image to enlarge)

There are three cases of deflation outside of a recession - early 1990′s, late 1990′s, and mid 2000′s. Import price deflation is normally associated with the strengthening of the dollar relative to other currencies.
According to the press release:
Imports: The price index for U.S. imports rose 1.4 percent in January following a 1.0-percent increase the previous month. Higher fuel and nonfuel prices both contributed to the advances in January and December. U.S. import prices rose 0.9 percent for the year ended in January, the first over-the-year increase since January 2020 and the largest 12-month advance since the index increased 3.4 percent from October 2017 to October 2018. Import fuel prices increased 7.4 percent in January following advances of 8.1 percent in December and 4.4 percent in November. In January, higher petroleum prices more than offset lower natural gas prices. Prices for import petroleum advanced 8.3 percent in January, after rising 9.3 percent in December and 2.5 percent in November. Despite the recent increases, import fuel prices decreased 13.4 percent for the year ended in January. A 14.3-percent decline in petroleum prices more than offset an 11.3- percent advance in natural gas prices. The 12-month decrease in fuel prices was the smallest over-the-year drop for the index since February 2020.
Exports: Prices for U.S. exports rose 2.5 percent in January, after advances of 1.3 percent in December and 0.7 percent in November. Higher agricultural and nonagricultural prices both contributed to the January increase in export prices. The price index for U.S. exports rose 2.3 percent for the year ended in January, the largest 12-month increase since the index advanced 3.1 percent in October 2018. (See table 2.) Agricultural Exports: Agricultural export prices increased 6.0 percent in January following a 0.9-percent advance in December. The January rise was the largest monthly increase since the index advanced 6.0 percent in July 2012; higher prices for soybeans, corn, wheat, cotton, meat, fruit, vegetables, and nuts all contributed to the January advance. Prices for agricultural exports rose 9.4 percent over the past year, the largest 12-month increase since the index advanced 9.6 percent in June 2013. The rise from January 2020 to January 2021 was led by a 41.5-percent increase in soybean prices and a 27.7-percent advance in corn prices.
Month-over-Month Change - Import Prices (blue line) and Export Prices (red line)
(Click on image to enlarge)

The biggest mover of import and export prices is usually oil (imports) and agricultural products (exports).
Oil Import Price Change Month-over-Month (blue line) and Agriculture Export Change Month-over-Month (red line)
(Click on image to enlarge)

Caveats on the Use of the Export / Import Price Index
Both import and export prices index values shown in this post is a weighted average for the entire category of exports or imports. The BLS has many sub-categories relating to a particular commodity or goods. Econintersect using spot checks believes these subindexes are accurate.
Disclaimer: No content is to be construed as investment advise and all content is provided for informational purposes only.The reader is solely responsible for determining whether any investment, ...
more

