ISM Services: 10th Consecutive Month Of Expansion
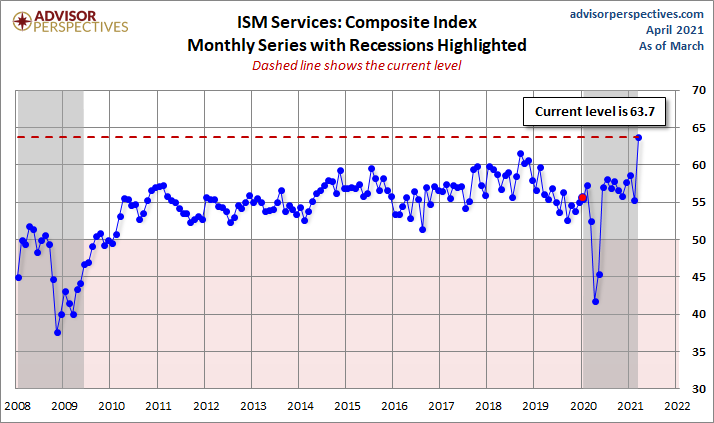
The Institute of Supply Management (ISM) has now released the March Services Purchasing Managers' Index (PMI). The headline Composite Index is at percent 63.7, up 8.4 from 55.3 last month. Today's number came in above the Investing.com forecast of 59.0 percent.
Here is the report summary:
(Tempe, Arizona) — Economic activity in the services sector grew in March for the 10th month in a row, say the nation’s purchasing and supply executives in the latest Services ISM® Report On Business®.
The report was issued today by Anthony Nieves, CPSM, C.P.M., A.P.P., CFPM, Chair of the Institute for Supply Management® (ISM®) Services Business Survey Committee: “The Services PMI® registered an all-time high of 63.7 percent, 8.4 percentage points higher than the February reading of 55.3 percent. The previous high was in October 2018, when the Services PMI® registered 60.9 percent. The March reading indicates the 10th straight month of growth for the services sector, which has expanded for all but two of the last 134 months.”
Nieves continues, “For further historical context, the Services PMI® debuted as the Non-Manufacturing NMI® in 2008, although subindex data was collected for years in advance. In August 1997, the four subindexes — Business Activity, New Orders, Employment and Supplier Deliveries — that make up the Services PMI® would have calculated a composite-index reading of 62 percent.
“The Supplier Deliveries Index registered 61 percent, up 0.2 percentage point from February’s reading of 60.8 percent. (Supplier Deliveries is the only ISM® Report On Business® index that is inversed; a reading of above 50 percent indicates slower deliveries, which is typical as the economy improves and customer demand increases.)
“The Prices Index figure of 74 percent is 2.2 percentage points higher than the February reading of 71.8 percent, indicating that prices increased in March, and at a faster rate. According to the Services PMI®, all 18 services industries reported growth. The composite index indicated growth for the 10th consecutive month after a two-month contraction in April and May. There was a substantial increase in the rate of growth in the services sector in March. Respondents’ comments indicate that the lifting of coronavirus (COVID-19) pandemic-related restrictions has released pent-up demand for many of their respective companies’ services. Production-capacity constraints, material shortages, weather and challenges in logistics and human resources continue to cause supply chain disruption,” says Nieves. [Source]
Unlike its much older kin, the ISM Manufacturing Series, there is relatively little history for ISM's Non-Manufacturing data, especially for the headline Composite Index, which dates from 2008. The chart below shows the Non-Manufacturing Composite. We have only a single recession to gauge is behavior as a business cycle indicator.
The more interesting and useful subcomponent is the Non-Manufacturing Business Activity Index. The latest data point at 69.4 percent is up 13.9 from a seasonally adjusted 55.5 the previous month.
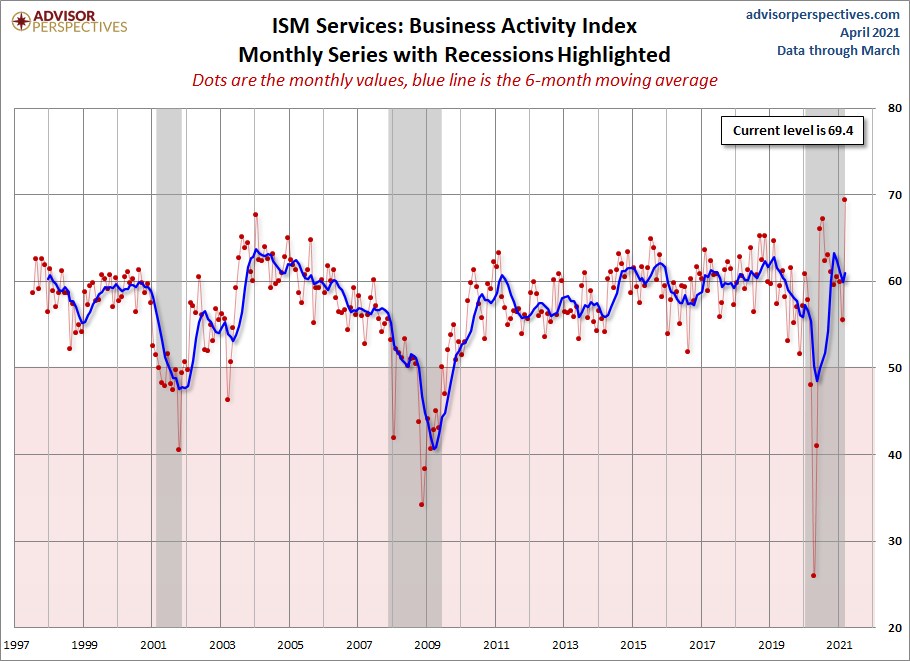
For a diffusion index, this can be an extremely volatile indicator, hence the addition of a six-month moving average to help us visualize the short-term trends.
Theoretically, this indicator should become more useful as the time frame of its coverage expands. Manufacturing may be a more sensitive barometer than Non-Manufacturing activity, but we are increasingly a services-oriented economy, which explains our intention to keep this series on the radar.
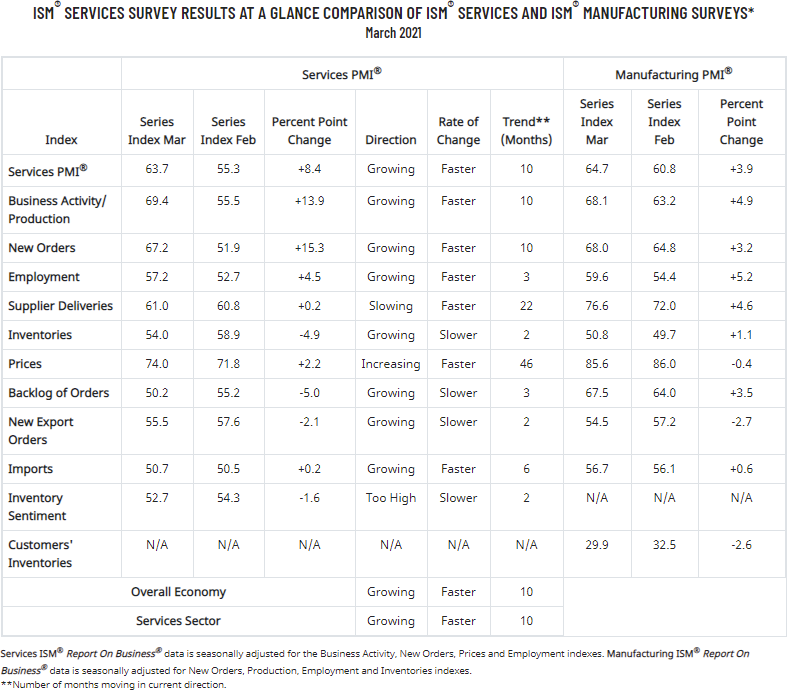
Here is a table showing the trend in the underlying components.
(Click on image to enlarge)