ISM Manufacturing Index: Up 1.6 In July
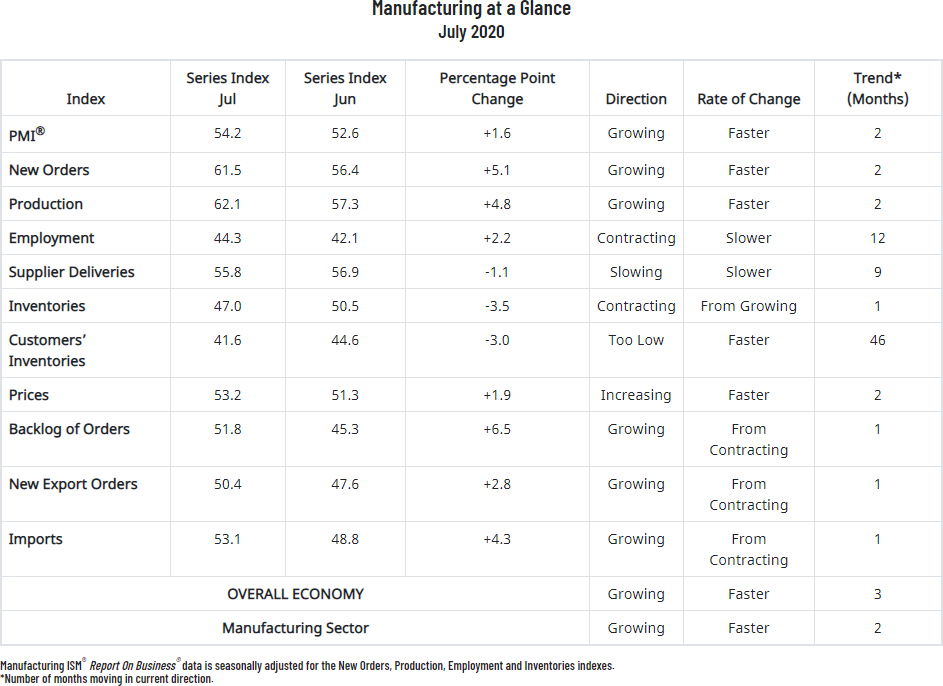
Monday, August 3, the Institute for Supply Management published its monthly Manufacturing Report for July. The latest headline Purchasing Managers Index (PMI) was 54.2, an increase of 1.6 from 52.6 the previous month. Monday's headline number was above the Investing.com forecast of 53.6%.
Here is the key analysis from the report:
“The Inventories Index registered 47 percent, 3.5 percentage points lower than the June reading of 50.5 percent. The Prices Index registered 53.2 percent, up 1.9 percentage points compared to the June reading of 51.3 percent. The New Export Orders Index registered 50.4 percent, an increase of 2.8 percentage points compared to the June reading of 47.6 percent. The Imports Index registered 53.1 percent, a 4.3-percentage point increase from the June reading of 48.8 percent.
“In July, manufacturing continued its recovery after the disruption caused by the coronavirus (COVID-19) pandemic. Panel sentiment was generally optimistic (two positive comments for every one cautious comment), continuing a trend from June.
"Demand expanded, with the (1) New Orders Index growing at a strong level, supported by the New Export Orders Index re-entering expansion; (2) Customers’ Inventories Index remaining at a level considered a positive for future production, and (3) Backlog of Orders Index returning to expansion for the first time in five months. Consumption (measured by the Production and Employment indexes) contributed positively (a combined 7-percentage point increase) to the PMI® calculation, with industries continuing to expand output after May’s return-to-work actions.
"Inputs — expressed as supplier deliveries, inventories and imports — weakened for the third straight month, due to supplier delivery issues abating and import levels re-entering expansion. Inventory levels contracted due to strong production output, supplier delivery difficulties and inventory minimization. Inputs contributed negatively (a combined 4.6-percentage point decrease) to the PMI® calculation but were more than offset by the demand and consumption improvement, as was the case in June. (The Supplier Deliveries and Inventories indexes directly factor into the PMI®; the Imports Index does not.) Prices remained in expansion, supporting a positive outlook.
“The growth cycle continues for the second straight month after three prior months of COVID-19 disruptions. Demand and consumption continued to drive expansion growth, with inputs remaining at parity with supply and demand. Among the six biggest industry sectors, Food, Beverage & Tobacco Products remains the best-performing industry sector, with Chemical Products, Computer & Electronic Products and Petroleum & Coal Products growing respectably. Transportation Equipment and Fabricated Metal Products continue to contract, but at soft levels,” says Fiore. See report
Here is the table of PMI components.
The chart below shows the Manufacturing Composite series, which stretches back to 1948. The eleven recessions during this time frame are indicated, along with the index value the month before the recession starts.
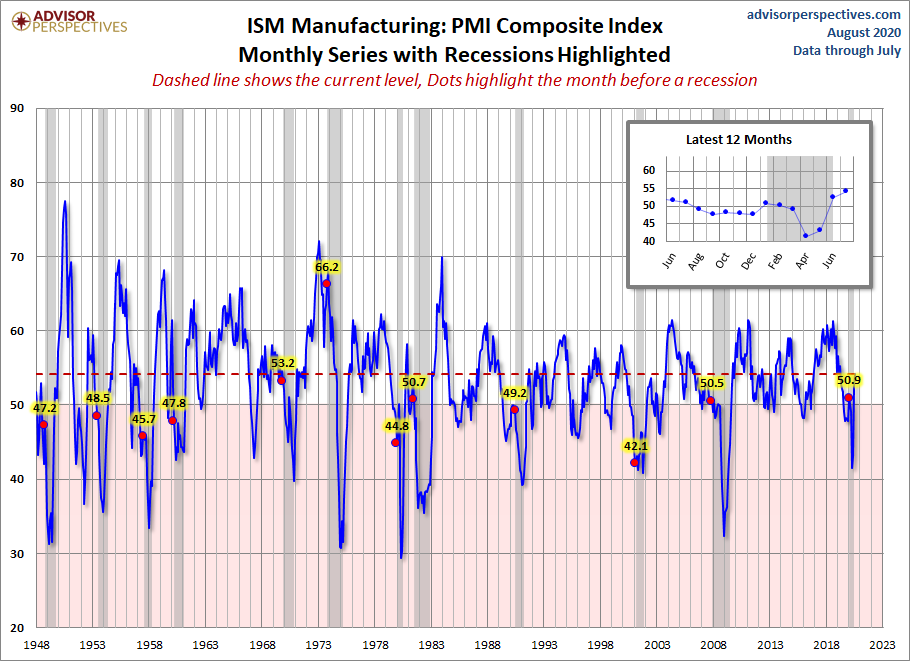
For a diffusion index, the latest reading is 54.2 and indicates expansion. What sort of correlation does that have with the months before the start of recessions? Check out the red dots in the chart above.
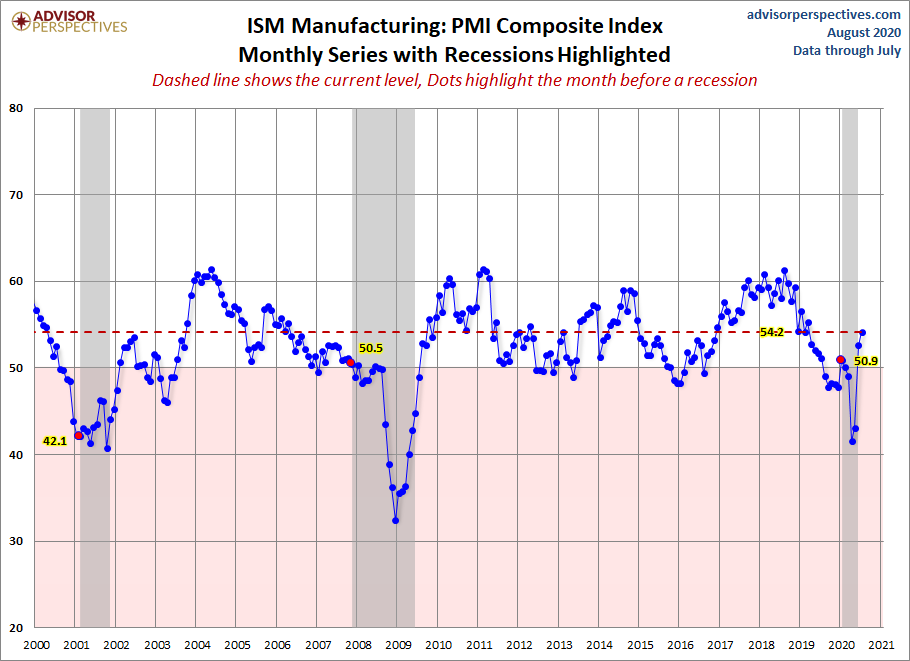
Here is a closer look at the series beginning at the turn of the century.