
Value “Investing” Always Works Even When The Value “Factor” Falters
I couldn’t begin to count how many times over the past couple of years I’ve heard or seen negative commentary regarding Value (and I’m sure if you comb through my own writings, you’ll catch me as having done it). Some say Value is dead. Some say it’s been dead for a long time. Others say it’s just cold. Others say things that can’t be printed. I propose a (slightly belated) New Year’s resolution. Let’s be clear about what we mean. Do we mean the Value “factor,” which has, indeed, been frosty? Or do we mean Value “investing” which has been just as sound and successful as it ever was and may well be the only logical way to invest? The distinction is not just a matter of verbal nit-picking. It goes to the heart of quantitative investing and how we contextualize(and invest based on) factors.

© Can Stock Photo / ChristianChan
First Things First: Value Investing ALWAYS Works
Imagine a world in which value investing did not work: Investors might pay, say, $65 for a stock that’s worth only $40.
“Big deal, that happens all the time”, one might say. Look what happened at the turn of the century leading up to the dot-com crash. Look what happened to FANG stocks just recently. Look what happened to...pick another example; market history is littered with anecdotes like those. We can even talk about the centuries-ago tulip craze.
And speaking of tulip bulbs, was that mania really an example of buyers ignoring value? Imagine you’re a Dutch collector as the market was rallying and approaching its peak. You’re about to buy a set of tulip bulbs for 500 Ws (Ws is a unit of currency I just invented — Whatevers — to spare me the burden of looking up the actual prices in terms of the actual currency). That’s a steep price compared to a year ago when the same set of bulbs would have fetched, say 150 Ws. Just as you’re about to make your purchase, another seller offers an identical set of bulbs a 485 Ws. “Is the market now falling,” you ask. “No. I have a more cost-efficient operation and can afford to offer the same goods at lower prices,” the second seller says. He continues to explain that he’s honing his craft to prepare for the 20th Century when he plans to reincarnate on the other side of the Atlantic as a guy named Sam Walton.

© Cam Stock Photo / masyusha
What would you do? Will you pay Sam Walton’s spiritual (and fictional – please don’t try to fact check this) ancestor 485Ws, or will you continue on your way and pay 15 Ws more than you need to pay to the other dealer for the same bulbs.
If your brain is wired similarly to the brains of the gazillion or so future humans who made Walmart the giant it became (not to mention Vanguard, E*trade, etc.), you’re going to get the best price you can for the goods or services you’re buying. So you’re into Value. That’s so even if tulips wind up selling for just 12 Ws a few years later.
Buyers always want good prices for what they get. That’s so even for U.S. shoppers who didn’t patronize Walmart and pay more elsewhere. If they pay more, they got more. Maybe it’s about convenience, service, better return privileges, a more pleasant shopping-day experience, or even snob appeals of being perceived as one who need not stoop down to standing in line at Walmart. Whatever the case, all buyers want the best prices for what they perceive themselves to be buying.
It’s The Same In Finance
The same holds true in the financial markets. Would you pay me $1.05 to buy a $1.00 bill from me? (If so, ping me privately to arrange a meeting, and give me time to get to my bank to obtain a lot more singles than I usually carry with me). Assuming you’re not a crazy person or one who is so anti-value you’d do anything to try to prove me wrong here, you’ll decline this offer because you know how much a $1.00 bill is worth, the time value of such a purchase, and the risks inherent in actually getting the benefit of what you buy. Based on all that, you want me more than a dollar (although you’d back up the truck if I were nutty enough to offer singles for $0.90).
A $1.00 bill is a financial asset, just like commercial paper, debentures, preferred stock, common stocks, etc. We never want to pay more than we think the asset we’re buying is worth. We’re human. This is inherent in the way we’re wired, even with common stock. Imagine yourself back in the days before online trading, when you had to deal with a human broker. Imagine you want to buy 100 shares of XYZ that last traded at 74 1/4; (Does anybody miss the good old day, with fraction-based pricing?) Your broker is in touch with two 100-share lots; one offered at 74 5/16 the other at 74 1/2 and asks which you want to buy. Is there any way you’ll not pick the $74 5/16 lot? It’s so obvious you will, that such conversations didn’t actually happen. It was presumed your broker would sell you the 74 5/16 lot, and automated trading algorithms do likewise today. Even with stock, you want the best price for that which you are buying.
But suppose a day later, you read an article that says the stock is worth only $65 per share, and the market price plummets. The pain you feel has nothing to do with whether value works or not. However, it has everything to do with whether you correctly assessed value (or whether the author and the market did so the next day). Somebody will eventually be proven right and the other, wrong.
Either way, value investing works. The catch is that some assets are harder to value than others. A $1.00 bill is easy to value. It’s a lot harder to value a share of common stock. (Click here for an expanded discussion along these lines). That’s where the action is. Value investors need a sensible way to put valuations on stocks, and P/E (or P/S or B/B etc.) is not it. Saying a low P/E is inherently better than a high P/E makes as much sense as saying a run-down 1-bedroom house in a bad neighborhood listed for $75,000 is better than a beautiful well-built 4-bedroom house in a great neighborhood listed for $1.05 million. Indeed, when we think of all the factors that are important to home buyers, the $1.05 million house might turn out to be a bargain while the $75,000 listing turns out to be overpriced.

© Can Stock Photo / Qingwa
Versus

© Can Stock Photo / alexh
Investing based solely on the value factor makes no more sense than investing buying a home based solely on the price (and without looking at any characteristics of the home).
Observing, as we do, how badly the Value factor has done in the recent past, we cannot and should not say Value investing doesn’t work. Instead, we have to say that Mr. Market has gone upscale, that he has favored company attributes normally associated with higher prices (i.e. higher valuation ratios), analogous to what might be the case if a greater number of homebuyers were to prefer well-located McMansions in lieu of handyman specials in blighted neighborhoods.
The Value Factor — Defined
This is easy, actually, so easy there can be multiple correct answers. It can be Price/Earnings, Price/Sales, Enterprise Value/Sales, Price/Free Cash Flow, Price/Book, etc., etc., etc. Lower is better. (Those who prefer higher-is-better sorting protocols can just turn the fractions upside down, so its Earning/Price, etc.). Personally, I prefer a multiple-criteria approach, to diversify against the risk that one or more individual ratios might be distorted by unusual items.
However, one wants to articulate it, the idea is to compare some measure of the company’s market value with some measure of the fundamental wealth it generates.
Value Investing — Defined
Here’s where things can get dicey. Many believe that value investing is the same thing as using the value factor to choose stocks with better (cheaper) valuation ratios. It’s the foundational assumption behind much literature and its the guiding principle behind the plethora of value-oriented ETFs out there. It’s also the presumed basis upon which commentators describing how bad value has been lately rely.
But it’s not so.
For convenience, let’s stick with P/E. We can then say a value investor looks to buy stocks whose P/Es are lower than they should be, and avoid those whose P/Es are higher than they ought to be. It sounds easy. But it’s not. It requires us to be able to state what a particular stocks’ P/E should be.
Here’s the formula for calculating a “correct” P/E:
- P/E = 1/(R – G), where
- R is the required rate of return for the stock, and
- G is the expected future rate of earnings growth.
R is a combination of the required return on risk-free investments, the extra return investors should expect by choosing the inherently risky equities asset class, one more adjustment for the risk characteristics unique to the specific company in question. As a matter of practice, we can assume companies that are high in terms of fundamental quality (margins, turnover, financial strength and return on capital) offer lower levels of company-specific risk (in “quant terms, these are the factors that influence what “Beta” is likely to be in the future).
The math works out such that P/E rises along with increases in Growth and/or improvements in Quality.
Click here for more on the logic behind all of this (including how and why Momentum and Sentiment can and often do serve as proxies for Growth).
This means that Value Investing isn’t simply a matter of picking favorable Value Factor scores. It is a matter of favorable Value combined with favorable Growth and/or Quality. Looking at one factor without the other is contrary to financial logic.
So Why Has The Value Factor Worked So Well, If Not Lately, Then At Least Over The Long Term
When we say Value is working, we’re really saying low P/E stocks are outperforming and/or that high P/E stocks are underperforming.
Low P/E will work (i.e. will lead to successful Value investing) when many low-P/E stocks incorrectly assess Quality and/or Growth when the market comes to realize that Growth and/or Quality are better than previously assumed. The Value factor works when Mr. Market is too pessimistic.
Also, high P/E will falter (i.e. lead to unsuccessful value investing) when investors come to realize that the Growth and/or Quality considerations that motivated high P/Es were too optimistic and that expectations need to come down So the Value Factor also works when Mr. Market is too optimistic.
Putting all this together the Value factor works when Mr. Market’s assessment of the company turns out wrong and needs to be adjusted.
Conversely, the Value factor, standing on its own, will fail as an investment criterion when expectations are accurate, when companies assumed by Mr. Market to be bad really are bad and when companies assumed by Mr. Market to be great really are great. And this, by the way, is why Value (the Value factor) has performed poorly of late (and why the situation may be starting to change).
Examining Recent Factor Performance With An Emphasis On Value
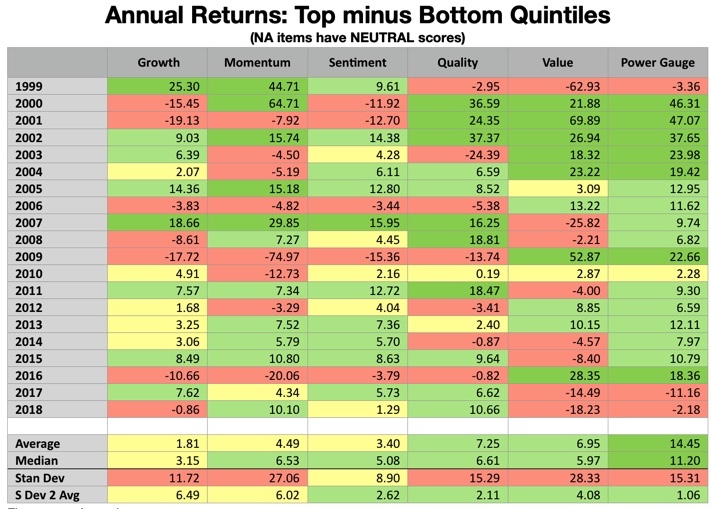
Table 1 shows differences in annual returns for each of six factor-based hypothetical portfolios. A universe similar to that of the Russell 3000 is sorted on the basis of each factor and divided into five quintiles (“buckets”). Each year’s figure represents the difference between the return of the top (best) bucket and the return of the worst. Consistent with what was stated above regarding Value, all of the factors consist of multiple items that diversify against the risk of distortion stemming from oddities that may, from time to time, cause distortions.
Table 1
(Click on image to enlarge)
At first glance, this may look similar to quilt-like diagrams offered by others to demonstrate the difficulty of consistently identifying the right thing (factor in this case, an asset class in other presentations) and the wisdom of throwing up one’s hands and investing passively in an index. I agree with the difficulty of choosing which factor will shine or dim from one period to the next, but rather than giving up, I prefer to work with a thoughtful strategically and logically designed multi-factor system that implements the factor relationships described above as value investing.
Sticking with the topic of the day, value, we see that this factor has, indeed, struggled of late and has also been erratic for much of the past ten years.
But we won’t stop with an assessment when the value was hot or not. We’ll use the comparison to glean the message of the market. When Value was out, what was in and why?
2017 was a bad year for the value factor, but decent or good for Quality, Growth, Momentum, and Sentiment. We presume from Value’s negative tally that many high ratio stocks did well. But this was not a dysfunction. It was a matter of stocks featuring strong growth prospects and/or high quality performed as expected; the high valuation ratios those stocks should have commanded were not an obstacle because the expectations were satisfied. 1999-2001 serves as an example of how important it is that expectations be satisfied and how when they aren’t, the value factor can come roaring back. Notice especially how quality fared in 1999. That tells us the grand expectations were associated with companies that were definitely not grand.
Compare 2017 with 2018. Again Value faltered and fared even worse than in 2017. High ratio stocks that were strong in terms of Momentum, Sentiment, and/or Quality, did well. The latter makes for an important distinction between now and 1999.
But look at how Growth fared in 2018. It fell, having parted company from Sentiment and Momentum. There’s a warning there. Sentiment and Momentum depend on opinions, expectations, and stories regarding the future. Growth consists of historic growth rates. Rather than encompassing expectations, Growth addresses that which has actually been delivered.
Compare that with Quality. This factor barely edged out Momentum as the top performer in 2918. These might seem to be strange bedfellows; Momentum tends to be seen as the riskiest factor while Quality is often seen as the most conservative. But let’s not tie ourselves to stereotypes (even those that may be consistent with long-term empirical observation).
Momentum and Quality are both associated with higher P/E. This stems from the basic P/E formulation. As Quality rises, that reduces the R (Required Return) — given that R is a positive number in the denominator of the 1/(R-G) fraction, as it declines, P/E is pushed upward. Momentum is a proxy for the G (Growth) factor — given that G is a negative number in the denominator, as G rises, so, too, does P/E.
The struggles we saw with the Value (price-tag only) factor don’t indicate that value investing was cold. It tells us instead, that the market chose to buy upscale in 2018; i.e. it paid what it perceived to have been fair prices for merchandise (stocks) that were, simply put, better (like a mansion compared to a dump).
What’s interesting is how Mr. Market defined “better.” In 2017 and 2018, company quality was deemed important (something that wasn’t so in 1999 and as we see through the intervening years, can’t always be taken for granted). But the way the G factor was handled changed. In 2017, it was all about the classic Growth factor, reflecting a willingness to extrapolate from historical performance. That changed in 2018: Growth receded (i.e., investors became less willing to project past performance forward) and subjective judgment about the future became more important. Judgment is encompassed through Sentiment (the wisdom of professional analysts) and Momentum (the wisdom of the crowd). The latter is what dominated.
The Message Of The Market (Translated From “Factorese”)
- The weakness in Value tells us Mr. Market is not bargain hunting; he’s looking for high-end — as defined by 1/(R-G) — merchandise. And he’s been successful in finding the merchandise he wants (as evidenced by the poor performance of the Value factor, which depends, for its success, on thwarted expectations).
- The role of Expectations (re: future growth) has changed from 2017 to 2018, In 2017, Mr. Market was happy and successful in paying up for high-growth companies based upon assumptions (whether explicit or implicit) that past trends could be counted on to persist into the future (the Growth factor cannot and should not be used unless one is willing to extrapolate from historical data). But investors, every bit as growth-oriented in 2018 as in 20917, became more willing to sever their expectations from historical performance and to instead, rely on judgment, primarily judgment of the crowd (i.e., the strength of Momentum).
- Multi-factor investing functioned as it should have. It touched all the bases and muted extremes. Power Gauge (weighed down by its exposure to the value factor) hasn’t shined in the recent past much the way a diversified portfolio won’t match what could have been achieved by a concentrated focus on one or two big winners. It’s always possible 2019 can look like 2018 and 2017, with Value cold and one or more of the Expectations proxies (Growth, Momentum, Sentiment) shining, probably along with Quality. But that’s a big ask. The fact that expectations have become untethered to actual performance and more tied to judgment, hope, stories, etc. makes for a softer foundation.
- While it’s certainly tempting to assume we can go on as we have, especially since there will always be many in the financial media to cheer us on in doing so, it may be more prudent to pull back a bit on story-based expectations and either demand more in the way of delivered growth (i.e., de-emphasize Momentum and Sentiment in favor of Growth) and perhaps consider a less intense focus on the high-end merchandise and more attention toward moderate and lower-priced goods, where expectations tend to be less buoyant. Put another way, as tempting as it is to abandon the Value factor right now, this may be the worst time to do something like that.
Disclosure: None.


