
Trend Following Investing Strategies: Examining The Whipsaw

Photo by Gavin Van Wagoner on Unsplash
Momentum and trend following models have been incorrectly marketed as able to “earn the upside without the downside.” In practice, momentum models have historically imposed a very real cost for side-stepping severe stock losses like 2008. The cost is paid through false-positive signals that whipsaw investors when trends slightly turn negative, but a larger correction doesn’t develop.
Imagine you know that a coin has a 25% probability of landing on heads. If you were offered a payoff of $0.50 per heads and $1 per tails, you should always bet on tails since it has a higher expected value. The expected value of betting on tails is its probability of 75% multiplied by its payoff of $1, or $0.75 per coin toss. This is greater than the $0.125 expected value (25% * $0.50) of betting on heads.
Now let’s say the payoffs were skewed, still paying the same $1 for tails, but now $5 for heads. The expected value of betting on heads changes from $0.125 (25% * $0.50) to $1.25 (25% * $5). This is greater than the $0.75 expected value of tails. In the long run, you’d make more money by betting on heads, regardless of its lower 25% probability.
The purpose of the coin flip example is to show that the payoff matters just as much as an event’s probability. To extend the coin flip example with market data, the table below shows every time over the past 25 years that absolute momentum has been negative for U.S. stocks.
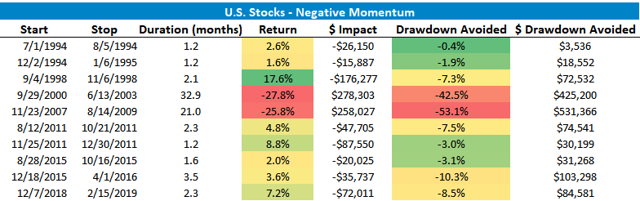
U.S. stocks are represented by VTI and then VTSMX. The absolute momentum metric is an average of 3-month, 6-month, 9-month, 12-month, and 15-month momentum. This average momentum number is then compared to the average momentum of short-term Treasuries. Short-term Treasuries are represented by SHV and then VFISX. U.S. stocks are said to have negative momentum if their average momentum is lower than short-term Treasuries.
The table shows how long absolute momentum was negative for U.S. stocks and their performance during that time window. The table also shows the dollar value of gains lost when stocks rose and the dollar value of losses avoided when stocks fell during the negative momentum window. Dollar values are for a hypothetical $1,000,000 position each time period. Observing only what happens between two points of time hides the volatility in the middle, so drawdown data is also included.
For example, from 7/1/1994 to 8/5/1994, U.S. stocks rose 2.6%. An absolute momentum model 100% in U.S. stocks would thus lose out on 2.6% in gains (or $26,150) since it would be out of the market. This is a false-positive momentum signal.
On the other hand, from 9/29/2000 to 6/13/2003, U.S. stocks fell -27.8%. The same momentum model avoided $278,303 in losses and a substantially large drawdown. This is a “correct” momentum signal since a larger correction materialized.
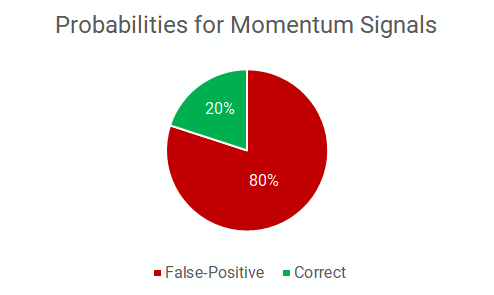
Returning to the coin flip example, the graph below shows the percentage of correct and false-positive momentum signals from the above momentum data on U.S. stocks.
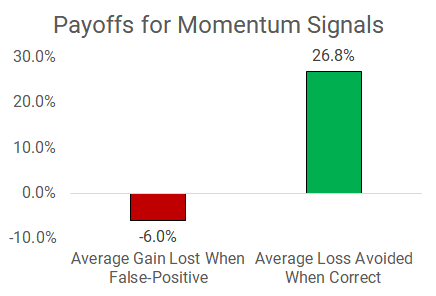
The payoffs chart shows the average gain lost and the average loss avoided.
A false-positive signal should be an investor’s baseline expectation when they’re using trend or momentum strategies. The asymmetry between gains lost and losses avoided is partly why momentum has been coined the “single biggest embarrassment” to the efficient market theory. This article solely looked at U.S. stocks, but there’s an ample amount of evidence on the persistence of momentum over many decades and across many asset classes.
Momentum and trend strategies are not a cure-all that allows you to participate in 100% of stock market gains without any downside. They have historically allowed you to capture a majority of the upside, but at the cost of occasional false-positives. I personally consider this a price worth paying to have a high probability of avoiding large future losses.
Let me know in the comments below if you have any questions, I’m happy to help out.
Disclosure: I am long VTI.
Additional disclosure: U.S. stock data is historical dividend adjusted data for VTI and VTSMX. Returns shown are total returns net of fund expense ratios but do not ...
more

