
S&P 500 (E-Mini): The Writing Is On The Wall
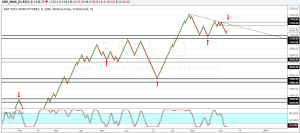
Ever since the S&P500 e-mini futures posted a fresh 52-week high near 2180, the price has been doing nothing but moving in range. Technical support at 2120 - 2110 is clearly the level that has managed to keep prices supported to the upside. Still, the failure to making new highs above 2120 - 2110 is a cause for concern.
The current consolidation shows a potential descending triangle pattern that is forming, which increases the risks of a downside breakout. It would be difficult to anticipate the breakout, and almost certainly, it will be hard to expect the price to retrace back to 2120 - 2110 to establish resistance.
What the 5 point ES mini futures Renko chart does show is that the index is in the final legs of printing another lower high following which we could expect to see some strong downside price action.
2159 - 2149 is the level of interest for chart watchers, as a possible reversal here could signal the decline in the ES mini futures, initially to 2120 - 2110, which by the time any short positions should ideally be trading at break-even and taking partial profits near 2120 - 2110 support.
If things go to plan, then the decline below 2110 should see a potential risk free trade set up, riding it all the way down to 2050 - 2040 where a potential rebound could occur.
There are two main fundamental catalysts that support this view. The first is the upcoming US general elections due to take place less than three weeks from now. While a Clinton victory could be a positive for the stocks, it is hard to anticipate a proper reaction. While the technical chart pattern in the S&P500 E-mini futures doesn't give out the results of the general elections, it is safe to surmise that investors will be cautious closer to the time.
Following the general elections, 4 - 5 weeks later, the Federal Reserve will be finally expected to hike interest rates by another 25bps, assuming that the economy doesn't go further downhill from where we stand. More importantly, inflation and jobs will be the key indicators with two more datasets to be released before the December D-Day meeting.
If history shows us anything, the S&P500 E-Mini futures could very well be seen throwing another tantrum similar to the one seen last year. However, considering that the index posted a decent rebound after the initial quarter or two of declines, there is a potential for history to repeat.
Based on the above, here's a potential trade plan for the S&P500 E-mini futures.
Look to sell near 2159 - 2149 with stops a few ticks above 2165. This puts the risk in the range of 6 - 16 ticks. Book initial profits at 2120 - 2110 and set the trade to break-even leaving no risk on the table at all.
The remainder of the trade should be playing out with a target level of 2050 - 2040 where we can expect a rebound back to the 2120 - 2110 region where support could be established. In the longer run, expect the S&P500 E-mini futures to slide to the next support at 1920 – 1930 if things go as planned.
I/We do not have any positions in the above mentioned instrument.


