
Latest Commitment Of Traders: Peeking Into The Future Thru Futures
Following futures positions of non-commercials are as of August 27, 2019.
10-year note: Currently net short 309.9k, down 91.9k.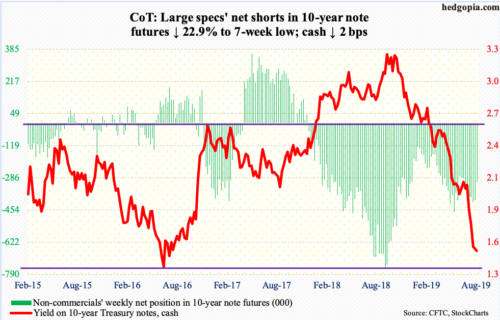
The 10-year Treasury yield (1.51 percent) could be setting up for a rally – duration and magnitude notwithstanding. Wednesday’s intraday low of 1.45 percent was 11 basis points short of 1.34 percent set in July 2016. Prior to that, in July 2012, rates fell to 1.39 percent before rallying. Time will tell, but this week’s action could very well be a test of those lows.
Medium- to long-term, there is this, though. Odds are growing the 10-year rate in due course is headed for a new low. Although decelerating, the US economy is still growing. In 2Q19, real GDP expanded at a two percent annual rate, down from 3.1 percent in 1Q19. The post-Great Recession recovery/expansion just completed a decade. There are signs of wear and tear. A recession is a matter of when, not if. If traders are buying these notes hand over fist now, we can imagine how they will behave during the next contraction.
Further, some $17 trillion in global bonds currently yield negative. In comparison, US sovereigns still yield positive, although yields are at/near new lows. Wednesday, the 30-year yielded 1.91 percent – a record low. In this environment, versus its European and Japanese peers, the US long end of the curve (price) can continue to attract bids. Thus, non-commercials, who still hold tons of net shorts in 10-year note futures, likely do well near term, but not medium- to long-term, as rates make fresh lows.
30-year bond: Currently net short 51.1k, down 13.9k.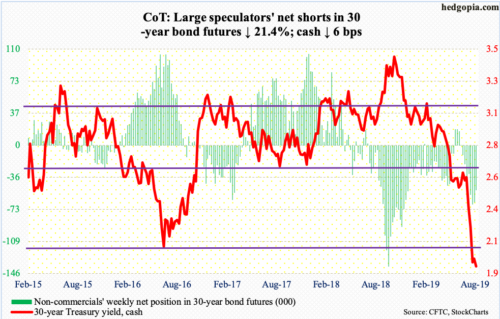
Major economic releases next week are as follows. Markets are closed Monday for observance of Labor Day.
The ISM manufacturing index (August) is scheduled for Tuesday. Manufacturing activity in July fell five-tenths of a point month-over-month to 51.2. This was the slowest pace since August 2016.
The ISM non-manufacturing index (August), durable goods (July, revised) and labor productivity (2Q19, revised) are on tap Thursday.
Services activity dropped 1.4 points m/m in July to 53.7 – the slowest since August 2016.
In the 12 months to July, orders for non-defense capital goods ex-aircraft – proxy for business capex plans – contracted 0.45 percent to a seasonally adjusted annual rate of $69.7 billion. The all-time high of $70 billion was recorded in July last year. Going forward, year-over-year comparisons will be tough, as in seven of nine months through March this year orders were in the $69 billion range.
Preliminarily, non-farm output per hour rose 1.8 percent y/y in 2Q19. This was the fastest pace in 17 quarters, and it was not even with a two handle. That is how suppressed productivity has been in the current cycle.
Friday brings employment report (August). July added 164,000 non-farm jobs, for a monthly average of 165,000 this year. This is still a decent pace, given the US economy has been in recovery/expansion for just over a decade now. That said, the pace is much slower than last year’s monthly average of 223,000.
WTI crude oil: Currently net long 555.2k, down 22.4k.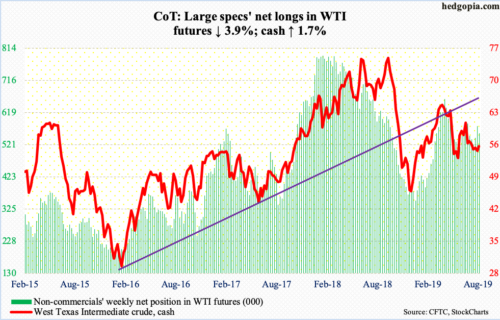
For the fourth consecutive week, the cash ($55.10/barrel) intraday breached trend-line support from last December but only to recapture it by close. The weekly low was posted Monday at $52.96. By Thursday, it rallied to $56.89 intraday – past 50- and 200-day, but that did not last very long. Friday, the averages were lost. There is trend-line resistance from last October’s high at $58. For now, the crude remains bound by these trend lines, with rising risks of a breach to the downside.
Wednesday’s 1.6-percent rally was helped by improved sentiment thanks to the latest EIA report. For the week of August 23, stocks fell across the board – crude down 10 million barrels to 427.8 million barrels and both gasoline and distillates down 2.1 million barrels each to 232 million barrels and 136.1 million barrels. Crude imports were down 1.3 million barrels per day to 5.9 mbpd. Crude production, however, rose 200,000 bpd to 12.5 mbpd – a new record. Refinery utilization dropped seven-tenths of a percentage point to 95.2 percent.
E-mini S&P 500: Currently net long 68.5k, up 11.9k.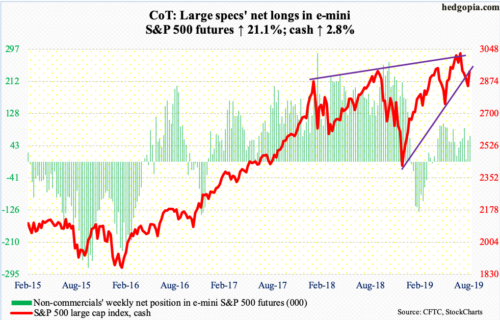
Last week, bulls were unable to defend a rising trend line from last December, although crucial support just north of 2800 continued to hold. This week, the underside of that trend line was tested around 2925, with the cash (2926.46) ending the week right on it.
The 50-day lies at 2945.04. Since the S&P 500 suffered a sharp selloff early this month, rally attempts have been rejected at that average several times. Friday’s high was 2940.43. There is also horizontal resistance at 2940s-50s, which has been a roadblock the last four weeks. Until this level is recaptured, sellers are likely to get active around here.
At least through Wednesday, flows continued to be negative. In the week through that session, SPY (SPDR S&P 500 ETF), VOO (Vanguard S&P 500 ETF) and IVV (iShares Core S&P 500 ETF) lost a combined $1.1 billion (courtesy of ETF.com). In the same week, $7.3 billion came out of US-based equity funds (courtesy of Lipper).
Euro: Currently net short 38.8k, up 827.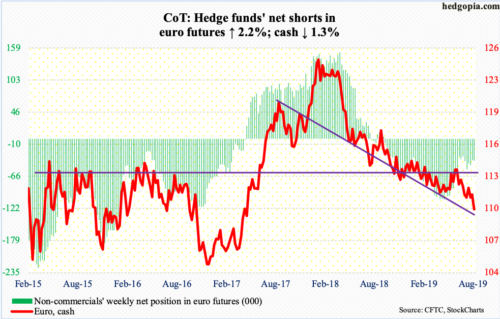
The cash ($109.92), which faced resistance at $111 early in the week, was down in all five sessions. Friday, the euro suffered a mini breakdown of sorts, with the intraday low of $109.63 the lowest since May 2017. This was yet another lower low in the ‘lower highs, lower lows’ pattern intact since the currency peaked in January last year at $125.37.
Gold: Currently net long 296.8k, down 3.2k.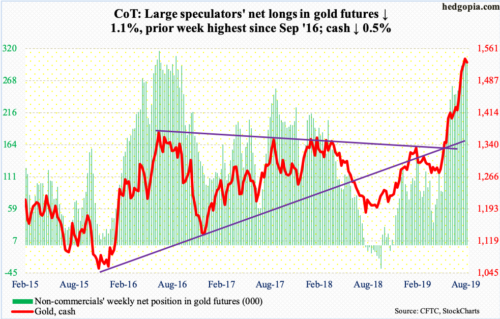
Flows continued to pour in. In the week ended Wednesday, IAU (iShares Gold Trust) gained $106 million – 10th positive week in 11. GLD (SPDR Gold ETF) took in $1.5 billion – 14th positive week in 15 (courtesy of ETF.com).
The cash ($1,529.40/ounce) Monday jumped intraday to $1,565, but was unable to hang on to the gains, in the end forming a shooting star. Action since has been lethargic. The metal is still above shorter-term averages, but the 10-day is flattish. Unless gold bugs act fast, this could be the first step toward a 10/20 rollover. Immediate support lies at $1,500, and after that $1,440s-50s.
Back in 2011-2013, gold peaked at record $1,923.70 in September 2011 and began to come under severe pressure after it lost $1,540s-50s.
Nasdaq 100 index (mini): Currently net long 22.9k, down 693.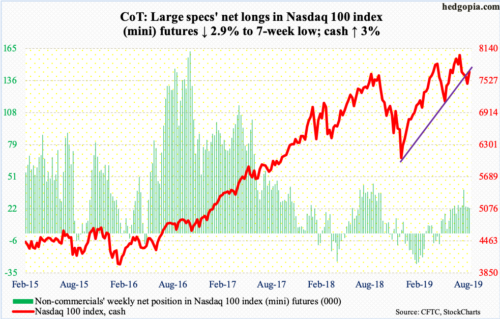
Last week, on an intraday basis, the cash (7691) landed right on a trend line from last December. This followed defense of that support in the prior two weeks. Wednesday this week, bids were again ready at that trend line.
In the week to Wednesday, QQQ (Invesco QQQ Trust) gained $107 million (courtesy of ETF.com).
For continued momentum, bulls now need to take care of one-year horizontal resistance at 7700, which approximates the 50-day at 7747.71. Short squeeze is possible should that occur. However, since the selloff early August, bulls have been rejected at this dual resistance several times, including Friday when sellers quickly took advantage of an early rally to exit.
Russell 2000 mini-index: Currently net short 59.3k, down 4.2k.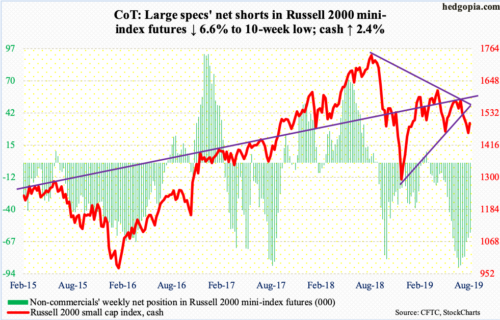
Wednesday, the cash (1494.84) undercut the mid-August low of 1456.28 but only by a whisker. Small-cap bulls aggressively bought that low. Support at 1450s goes back to July last year.
Month-to-date, the 200-day (1516.02) has repeatedly provided resistance. Friday, with an intraday high of 1504.45, sellers showed up right on cue.
In the week to Wednesday, $610 million and $67 million came out of IWM (iShares Russell 2000 ETF) and IJR (iShares Core S&P Small-Cap ETF) respectively (courtesy of ETF.com).
US Dollar Index: Currently net long 29.9k, up 398.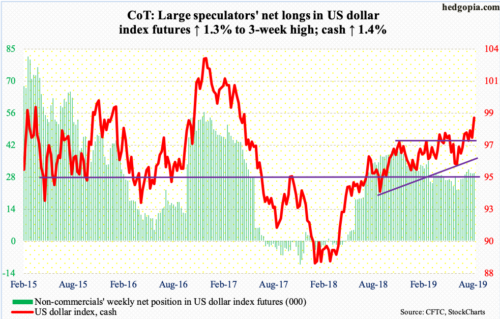
Dollar bulls stepped up this week to defend 97.50s. Monday, the cash (98.86) slightly breached this support intraday but was reclaimed by close. On August 1, the US dollar index retreated after tagging 98.70 intraday. Friday’s 98.97, which was the highest since May 2017, keeps the prevailing uptrend intact. For over a year now, the index has made higher highs and higher lows.
VIX: Currently net short 57.2k, down 2.3k.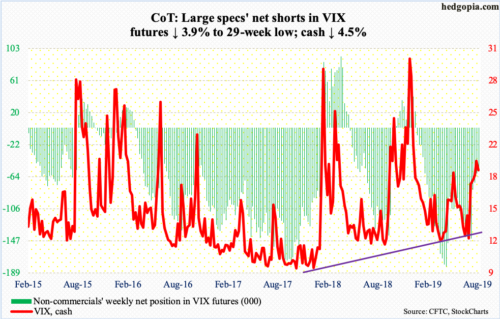
Since August 5 when the S&P 500 tagged 2822.12, the index has subtly made higher lows. VIX (18.98) peaked at 24.81 on that date and has since made lower highs. That said, last week, volatility bulls showed up at the slightly rising 50-day. Friday this week, they defended the 200-day. If the status quo remains, a golden cross is just a matter of time.
In contrast, the 21-day moving average of the CBOE equity-only put-to-call ratio has come under pressure since printing 0.733 on Friday last week. It closed out this week at 0.722. There is plenty of room for continued unwinding, which should help stocks. On Christmas Eve last year, the ratio peaked at 0.744. The S&P 500 made an important low back then.


