
In Search For Cheap Stocks With Improving Fundamentals
A simple and straightforward approach to investing can be particularly effective. At the end of the day, the main two questions for investors are what to buy and when to buy it. The numbers alone don't tell you everything you need to know to make investment decisions, but hard data can be remarkable value when trying to identify promising ideas based on quantified metrics as opposed to subjectivities and opinions.
This article is introducing a quantitative screener that looks for relatively undervalued stocks that are also benefiting from improving earnings estimates among Wall Street analysts. In other words, we are looking to buy cheap stocks, and we are also looking to buy them at times when the business fundamentals are improving as reflected by analyst expectations.
Cheap Valuation And Improving Expectations
Most valuation indicators have a key weakness, which is that they don't include growth in the equation. Ratios such as price to earnings (P/E) or price to cash flow (P/FCF) can be very intuitive and useful. However, if two companies have different expected growth rates, then the analysis is far more nuanced than simply looking at the stock price versus current earnings or cash flows.
The price to earnings growth - PEG - ratio, on the other hand, incorporates the impact of different growth rates into the valuation. The PEG ratio is simply obtained by dividing the P/E ratio by the expected long-term growth rate in earnings. In this case, we are using long-term growth expectations.
All else the same, the higher the expected growth in earnings, the more valuable each dollar in earnings from such a company. In other words, the P/E ratio is obviously higher for high growth companies.
This means that focusing solely on the P/E ratio would make high-growth companies erroneously look overvalued when comparing stocks. By dividing the P/E ratio by the expected earnings growth rate, the resulting ratio is far more comprehensive.
Even when the valuation ratios are low, investors need to pay careful considerations to the business fundamentals. When the fundamentals are deteriorating, even the cheapest stock in the world can turn out to be a disappointing investment.
In order to make sure that the company remains strong, the screener also requires companies to have rising earnings estimates over the past 13 weeks. Only because earnings estimates are rising, this does not guarantee that the business is thriving. However, it can be a powerful rule of thumb in order to eliminate companies that are facing declining earnings, which in many cases can produce a lot of damage to a portfolio.
From a starting universe of nearly 6,000 stocks, with are getting only 462 names that have a market capitalization value above $250 million and meet the criteria above of the PEG ratio below the industry average and rising earnings estimates.
To narrow the universe further, we select among that group the 25 stocks with the strongest ranking based in the PowerFactors algorithm. This is a quantitative algorithm that grades companies in a particular universe according to a combination of factors, including financial quality, valuation, fundamental momentum, and relative strength.
In simple terms, the PowerFactors system is looking to buy good businesses (quality) for a reasonable price (valuation) when the company is doing well (fundamental momentum) and the stock is outperforming (relative strength).
Wrapping up the screener criteria:
- Only companies with a market capitalization value above $250 million are considered.
- Companies need to have a PEG ratio below the industry average.
- Earnings expectations for the current year must have been increased in the past 13 weeks.
- Among the companies that meet the criteria above, we select the 25 stocks with the highest PowerFactors ranking.
Backtested Performance And Recommended Portfolio
The backtested performance chart below shows how the 25 stocks selected by the screener performed in comparison to the SPDR S&P 500 (SPY) ETF since 1999. Trading expenses are assumed to be 0.2% per transaction and the portfolio is rebalanced every four weeks.
The system more than doubled the benchmark, with annual returns of 14.84% per year versus an annual return of 6.55% for the market-tracking ETF in the same period. In cumulative terms, the system gained 1712.79% versus 277.16% for the benchmark. Alpha amounts to 9.12% annually.
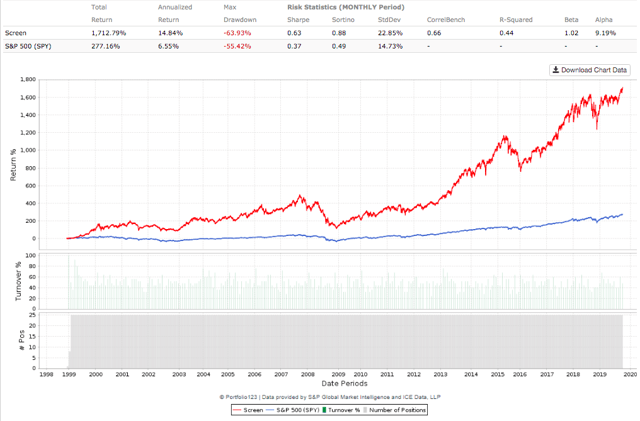
Data from S&P Global via Portfolio123
The table shows more detailed statistics about return and risk over different periods.
| Screen | SPY | |
| Annualized | 14.84% | 6.55% |
| One Month | 2.99% | 2.45% |
| One Year | 18.46% | 21.84% |
| Three Year | 61.59% | 48.51% |
| Five Year | 88.24% | 74.31% |
| Total | 1712.79% | 277.16% |
| Sharpe Ratio | 0.63 | 0.37 |
| Sortino Ratio | 0.88 | 0.49 |
| Max Drawdown | -63.93% | -55.42% |
| Standard Deviation | 22.85% | 14.73% |
| Correlation | 0.66 | - |
| R-Squared | 0.44 | - |
| Beta | 1.02 | - |
| Alpha (annualized) | 9.19% | - |
Backtested performance numbers should always be taken with a grain of salt. The data shows that companies with strong quantitative attributes tend to deliver higher returns over the long term, but this does not say much about any of the individual stocks in the screener will perform in a particular year.
When we look at the performance numbers over different periods, we can also observe that the screener has underperformed versus SPY in the past year. This is perfectly natural and even should be expected. There is no strategy - quantitative or discretionary - that can beat the market every year and in all kinds of environments.
The strategy also gravitates toward relatively small and volatile stocks since many times those kinds of stocks are the ones that trade at cheaper valuations. The screener outperforms the market in terms of both return alone and risk-adjusted return, but we need to consider that risk levels are also higher than those of the benchmark.
If we look at risk metrics such as standard deviation and drawdown, it's easy to see that the strategy is far more volatile than the benchmark, even if it offers superior risk-adjusted-performance.
The table below shows the 25 stocks currently selected by the screener. Data also includes market capitalization value in millions, PEG ratio, Industry PEG ratio, current EPS estimate, and the EPS estimate 13 weeks ago in order to provide more details about the parameters in the screener criteria for the different stocks.
| Ticker | Name | Mkt cap | PEG | PEG Ind | EPS | EPS 13WkAgo |
| NMIH | NMI Holdings Inc | $2,254.50 | 0.4 | 1.45 | 2.55 | 2.41 |
| BMY | Bristol-Myers Squibb Co | $104,176.48 | 1.35 | 1.92 | 4.43 | 4.29 |
| ESNT | Essent Group Ltd | $5,312.79 | 0.96 | 1.45 | 5.58 | 5.48 |
| ATKR | Atkore International Group Inc | $1,957.08 | 1.03 | 1.89 | 3.87 | 3.79 |
| OMF | OneMain Holdings Inc | $5,925.62 | 0.67 | 0.77 | 6.48 | 6.16 |
| LRCX | Lam Research Corp | $41,244.78 | 1.3 | 1.84 | 15.06 | 13.64 |
| WAL | Western Alliance Bancorporation | $5,743.68 | 1.02 | 1.56 | 4.75 | 4.71 |
| AMAT | Applied Materials Inc. | $55,757.79 | 1.05 | 1.84 | 3.75 | 3.41 |
| SEDG | SolarEdge Technologies Inc | $4,240.68 | 0.99 | 1.84 | 4.03 | 3.84 |
| RMD | Resmed Inc | $21,888.83 | 1.77 | 2.61 | 4.12 | 4 |
| INCY | Incyte Corp | $19,997.47 | 0.86 | 1.46 | 2.78 | 2.54 |
| IBP | Installed Building Products Inc | $2,063.97 | 0.58 | 1.05 | 3.24 | 3.1 |
| FORM | FormFactor Inc | $1,890.13 | 1.32 | 1.84 | 0.94 | 0.81 |
| FNV | Franco-Nevada Corp | $18,407.39 | 1.75 | 2 | 1.72 | 1.59 |
| RDN | Radian Group Inc. | $5,255.67 | 1.43 | 1.45 | 3.11 | 3.01 |
| PHM | PulteGroup Inc | $10,738.58 | 0.76 | 1.05 | 3.58 | 3.42 |
| WGO | Winnebago Industries Inc. | $1,534.10 | 0.69 | 1.45 | 4.11 | 3.91 |
| STMP | Stamps.com Inc | $1,454.44 | 1.25 | 1.58 | 4.55 | 4.27 |
| KNL | Knoll Inc | $1,373.79 | 1.11 | 1.84 | 2.08 | 2.04 |
| FTNT | Fortinet Inc | $17,883.72 | 2.63 | 2.7 | 2.41 | 2.25 |
| TPX | Tempur Sealy International Inc | $4,629.22 | 0.61 | 1.05 | 3.78 | 3.5 |
| PAAS | Pan American Silver Corp | $4,456.31 | 1.2 | 2 | 0.58 | 0.38 |
| VCTR | Victory Capital Holdings Inc | $1,474.44 | 0.22 | 2.31 | 2.57 | 2.55 |
| RBA | Ritchie Bros Auctioneers Inc | $4,677.92 | 1.24 | 1.84 | 1.3 | 1.28 |
| TER | Teradyne Inc. | $11,189.42 | 1.65 | 1.84 | 2.73 | 2.5 |
This screener is based on pretty narrow criteria, and it does not include any sector diversification considerations, which obviously carries some concentration risks. In any case, the main idea is not buying any particular stock based solely on the numbers, but rather using this list as a source of ideas for further research.
The main point is that information is power, and relying on hard data to identify undervalued companies with rising earnings expectations makes a lot of sense when looking for attractive opportunities for alpha generation.
Disclosure: I have no positions in any stocks mentioned, and no plans to initiate any positions within the next 72 hours.
Disclaimer: I wrote this article myself, and it expresses my own ...
more

