
How To Combine Value And Quality To Outperform The Market
Successful investing doesn't need to be too complex or sophisticated. In the end, it all comes down to buying good companies for an attractive valuation. This is easier said than done, though, and the right implementation is even more important than designing a good strategy.
The following paragraphs will be introducing a quantitative strategy based on a combination of quality and value factors. The main idea is relying on multiple indicators to invest in the companies that have the strongest metrics based on those two return drivers together. Backtested performance numbers look quite strong over the long term.
Investors should never buy a stock solely because the numbers look good, it's important to understand the main success drivers and risk factors in the business in order to tell if financial performance will be sustainable or not in the future. However, a quantitative system such as this one can be a valuable tool to identify promising investment ideas supported by hard data and statistical evidence.
The Rationale Behind The Strategy
At the end of the day, a stock is simply a share in the ownership of the business. This means that quality and value are two key return drivers for stocks over the long term. You basically want to invest in companies with solid financial performance in areas such as revenue growth and profitability (quality) and you also want to buy those stocks for an attractive price (value).
Combining these two return drivers can be particularly helpful in terms of having a balanced perspective and avoiding the most typical mistakes that investors generally make. Quality-oriented investors always run the risk of paying an exaggerated valuation, while value investors many times make big mistakes when they invest in companies with deteriorating fundamentals quality.
There is plenty of
showing that quality and value stocks tend to outperform the market, and combining the two factors together can produce an even stronger performance on a risk-adjusted basis.
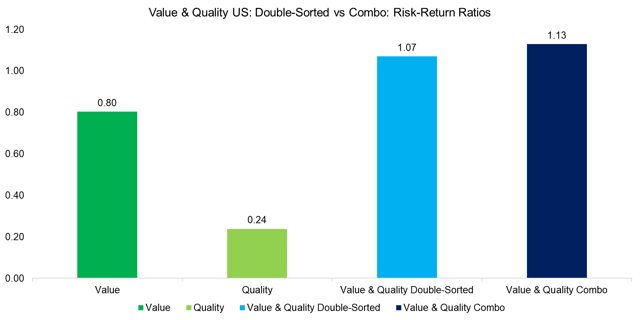
Source: Factor Research
In simple terms, both value and quality are powerful and time-tested return drivers for stocks and the combination of the two factors makes a lot of sense from a theoretical and evidence-based perspective.
Strategy Design
This particular strategy includes only companies in the Russell 3000 Index in order to guarantee that the stocks considered for inclusion offer acceptable characteristics in terms of size and liquidity. The strategy is based on a ranking algorithm that is made 50% of quality and 50% of value factors.
The metrics considered in the quality factor are:
- Gross Margin
- Free Cash Flow Margin
- Return on Investment
- Return on Equity
- Long Term Earnings Growth Expectations
The metrics considered in the value factor are:
- Forward Price to Earnings
- Price to Earnings Growth (based on long term earnings growth projections)
- Price to free cash flow
- Enterprise Value to EBITDA
This strategy is based on long term return drivers, and it does not include any price performance parameters, so it doesn't need to be updated very often and annual rebalancing works well enough.
Every year we run the quality and value algorithm on the companies included in the Russell 3000 Index and we pick the best 50 stocks in such index according to the algorithm. The backtesting technology uses only the data available at the time of the rebalancing, so we don't need to worry about survivorship bias and information availability.
Backtested Performance
The backtest builds an equally weighted portfolio with the 50 stocks selected by the quantitative algorithm and it compares performance versus the iShares Russell 3000 ETF (IWV). Trading expenses are assumed to be 0.2% per transaction, and the portfolio is rebalanced every 52 weeks.
The backtested performance metrics are quite strong. Since January of 1999, the strategy gained 1,547% versus a cumulative gain of 243% for iShares Russell 3000 ETF in the same period. In annual terms, the strategy gained 14.73% while the benchmark gained 6.23%, and Alpha produced by the quantitative strategy amounted to 8.83% per year.
To put the numbers in perspective, a $100,000 investment in the portfolio recommended by the quantitative strategy in 1999 would have turned into $1.6 million, while the same amount of capital allocated to the market-tracking ETF would have a current value of $343,000.
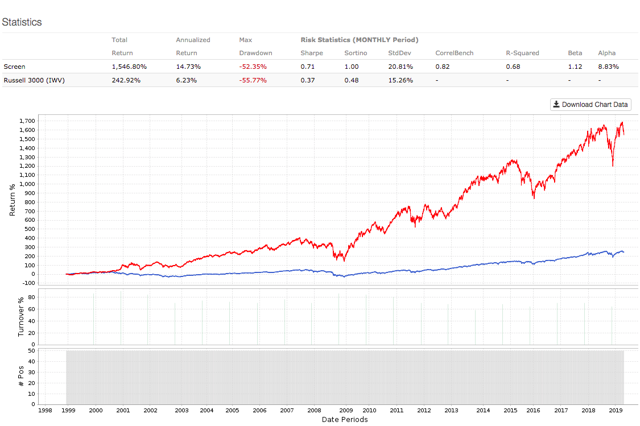
Data from S&P Global via Portfolio123
The long term performance metrics are arguably the most important, but we also need to take a deeper look at shorter timeframes in order to fully understand what kinds of returns can be expected. The table shows some relevant metrics for the quantitative strategy and the benchmark over different periods.
| Returns | Strategy | Benchmark |
| Annualized | 14.73% | 6.23% |
| Three Year | 51.01% | 45.05% |
| Five Year | 41.27% | 59.90% |
| Total | 1,546.80% | 242.92% |
| Risk Metrics | ||
| Sharpe Ratio | 0.71 | 0.37 |
| Sortino Ratio | 1.00 | 0.48 |
| Max Drawdown | -52.35% | -55.77% |
| Standard Deviation | 20.81% | 15.26% |
| Correlation | 0.82 | - |
| R-Squared | 0.68 | - |
| Beta | 1.12 | - |
| Alpha (annualized) | 8.83% | - |
Data from S&P Global via Portfolio123
The strategy outperformed the benchmark in the past 20 years, and also in the past 3 years. However, returns in the past 5 years are below those of the benchmark. This is to be expected, no strategy can outperform the market in each and every year, and even the quantitative strategies with the best long term return metrics can go through several years of underperformance.
The stock market is a complex, adaptive system. If a particular strategy could outperform in each and every year, then it would attract massive amounts of capital, and this would ultimately reduce performance.
The reason why some quantitative factors - and the strategies based on those factors - outperform over the long term is that they don't outperform in every year, and they can deliver disappointing performance for several years in a row.
This means that investors looking to outperform the market with these kinds of strategies need to be patient and have a long term horizon in order to benefit from a quantitative edge in the markets.
Portfolio Positions And Forward-Looking Considerations
The table below shows the 50 stocks currently selected by the quantitative system. Data in the table also shows market capitalization in millions, forward price to earnings and return on equity to provide an idea about size, valuation, and profitability for the companies considered.
| Ticker | Name | MktCap | Fwd PE | ROE% |
| CELG | Celgene Corp | $67,400 | 8.9 | 71.16 |
| SCHW | Schwab (Charles) Corp | $56,765 | 15.28 | 20.85 |
| BIIB | Biogen Inc | $44,423 | 7.74 | 33.47 |
| AMAT | Applied Materials Inc. | $37,919 | 13.36 | 45.74 |
| MU | Micron Technology Inc. | $37,405 | 5.32 | 43.34 |
| AMTD | TD AMERITRADE Holding Corp | $28,409 | 12.82 | 25.23 |
| LRCX | Lam Research Corp | $27,796 | 12.91 | 44.17 |
| LUV | Southwest Airlines Co. | $27,675 | 11.23 | 24.62 |
| DFS | Discover Financial Services | $24,908 | 8.72 | 26.68 |
| FITB | Fifth Third Bancorp | $19,979 | 9.46 | 13.65 |
| NTAP | NetApp Inc | $15,230 | 12.52 | 74.06 |
| DISCA | Discovery Inc | $14,492 | 7.41 | 11.76 |
| CE | Celanese Corp | $12,486 | 9.35 | 37.62 |
| SWKS | Skyworks Solutions Inc | $11,823 | 10.42 | 26.27 |
| SIVB | SVB Financial Group | $11,563 | 10.66 | 21.88 |
| ETFC | E-TRADE Financial Corporation | $11,361 | 10.73 | 17.82 |
| CMA | Comerica Inc | $11,136 | 8.75 | 16.78 |
| URI | United Rentals Inc. | $9,339 | 6.08 | 33.83 |
| ATH | Athene Holding Ltd | $8,361 | 5.84 | 15.87 |
| ADS | Alliance Data Systems Corp | $7,423 | 7.36 | 45.91 |
| EWBC | East West Bancorp Inc. | $6,587 | 9.11 | 15.88 |
| ALSN | Allison Transmission Holdings Inc | $5,317 | 7.14 | 90.22 |
| MTG | MGIC Investment Corp | $4,852 | 8.07 | 19.25 |
| RDN | Radian Group Inc. | $4,752 | 7.75 | 19.59 |
| NXST | Nexstar Media Group Inc. | $4,711 | 16.4 | 22.75 |
| ESNT | Essent Group Ltd | $4,696 | 8.97 | 21.4 |
| WAL | Western Alliance Bancorporation | $4,532 | 9.23 | 18.18 |
| JCOM | j2 Global Inc | $4,038 | 12.03 | 13.63 |
| WTFC | Wintrust Financial Corp. | $3,968 | 10.51 | 11.39 |
| LAZ | Lazard Ltd | $3,673 | 8.68 | 54.72 |
| TGNA | TEGNA Inc | $3,396 | 11.72 | 34.41 |
| TCF | TCF Financial Corp | $3,286 | 10.21 | 12.54 |
| AMCX | AMC Networks Inc | $3,092 | 6.42 | 126.13 |
| URBN | Urban Outfitters Inc | $2,470 | 9.93 | 20.71 |
| FBP | First BanCorp (Puerto Rico) | $2,175 | 13.01 | 10.85 |
| NMIH | NMI Holdings Inc | $1,859 | 11.94 | 17.5 |
| USNA | USANA Health Sciences Inc | $1,737 | 14.15 | 30.66 |
| BUSE | First Busey Corp | $1,395 | 11.72 | 9.63 |
| RCII | Rent-A-Center Inc | $1,260 | 11.18 | 12.98 |
| VCTR | Victory Capital Holdings Inc | $1,205 | 7.15 | 15.58 |
| ECPG | Encore Capital Group Inc | $1,108 | 6.49 | 19.33 |
| BY | Byline Bancorp Inc | $688 | 11.73 | 8.47 |
| PFBC | Preferred Bank of Los Angeles | $663 | 8.71 | 18.21 |
| STMP | Stamps.com Inc | $607 | 8.77 | 23.66 |
| SOI | Solaris Oilfield Infrastructure Inc | $465 | 7.94 | 31.16 |
| MCFT | MasterCraft Boat Holdings Inc | $416 | 7.98 | 73.69 |
| ACBI | Atlantic Capital Bancshares Inc | $414 | 14.89 | 9.34 |
| PETS | PetMed Express Inc | $380 | 11.06 | 30.14 |
| MRLN | Marlin Business Services Corp | $285 | 10 | 12.42 |
| HEAR | Turtle Beach Corp | $126 | 8.4 | 298.55 |
From a practical perspective, it's important to keep in mind that the annual turnover for this strategy is generally around 40%, and it can go as high as 70% in some particular years. Trading expenses are already incorporated into the return calculations, but taxes can have a material impact on returns in many cases. Besides, this strategy does not incorporate any sector diversification measures, so it can be quite concentrated in some specific sectors from time to time.
When a stock is selling at an attractive valuation considering its financial quality, this generally means that the market is concerned about the company's future. Investors tend to overreact to short-term uncertainty, and this is one of the main reasons why strategies such as this one outperform the market over the long term.
However, there is always the risk that the market could be right in a particular case. If the company is facing a permanent deterioration in fundamentals, then the stock will ultimately be a losing investment, no matter how good the numbers look in the present.
You can't build a complete investment thesis for a stock based solely on the numbers. The quantitative strategy is based on past performance and current expectations about the future. Investors need to examine the business behind those numbers in order to make sure that the company is strong enough to sustain financial performance.
Besides, the results from the strategy are based on large numbers of observations over long periods of time. This does not tell us much about how a particular stock is going to perform in a particular year.
In a nutshell, the quantitative strategy can provide a good starting point to identify promising ideas for further research, but the research process starts with the numbers, it does not end there.
Those limitations being acknowledged, investment decisions based on hard data and statistical evidence are superior to those based solely on opinions and subjectivities. By incorporating quantitative tools into the investment process, investors can optimize decision-making and generate stronger returns over the long term.
Disclosure: I am long LRCX.
Disclaimer: I wrote this article myself, and it expresses my own opinions. I am not receiving compensation for it. I have no business relationship with any ...
more

